

What is Report Center?
Report Center is a simple and easy-to-use business intelligence tool that lets users learn and understand their company’s data.
It lets you view, modify and schedule reports with ease. Your reports are categorised into different catalogs that help you navigate and find reports conveniently.
Getting started
Logging In
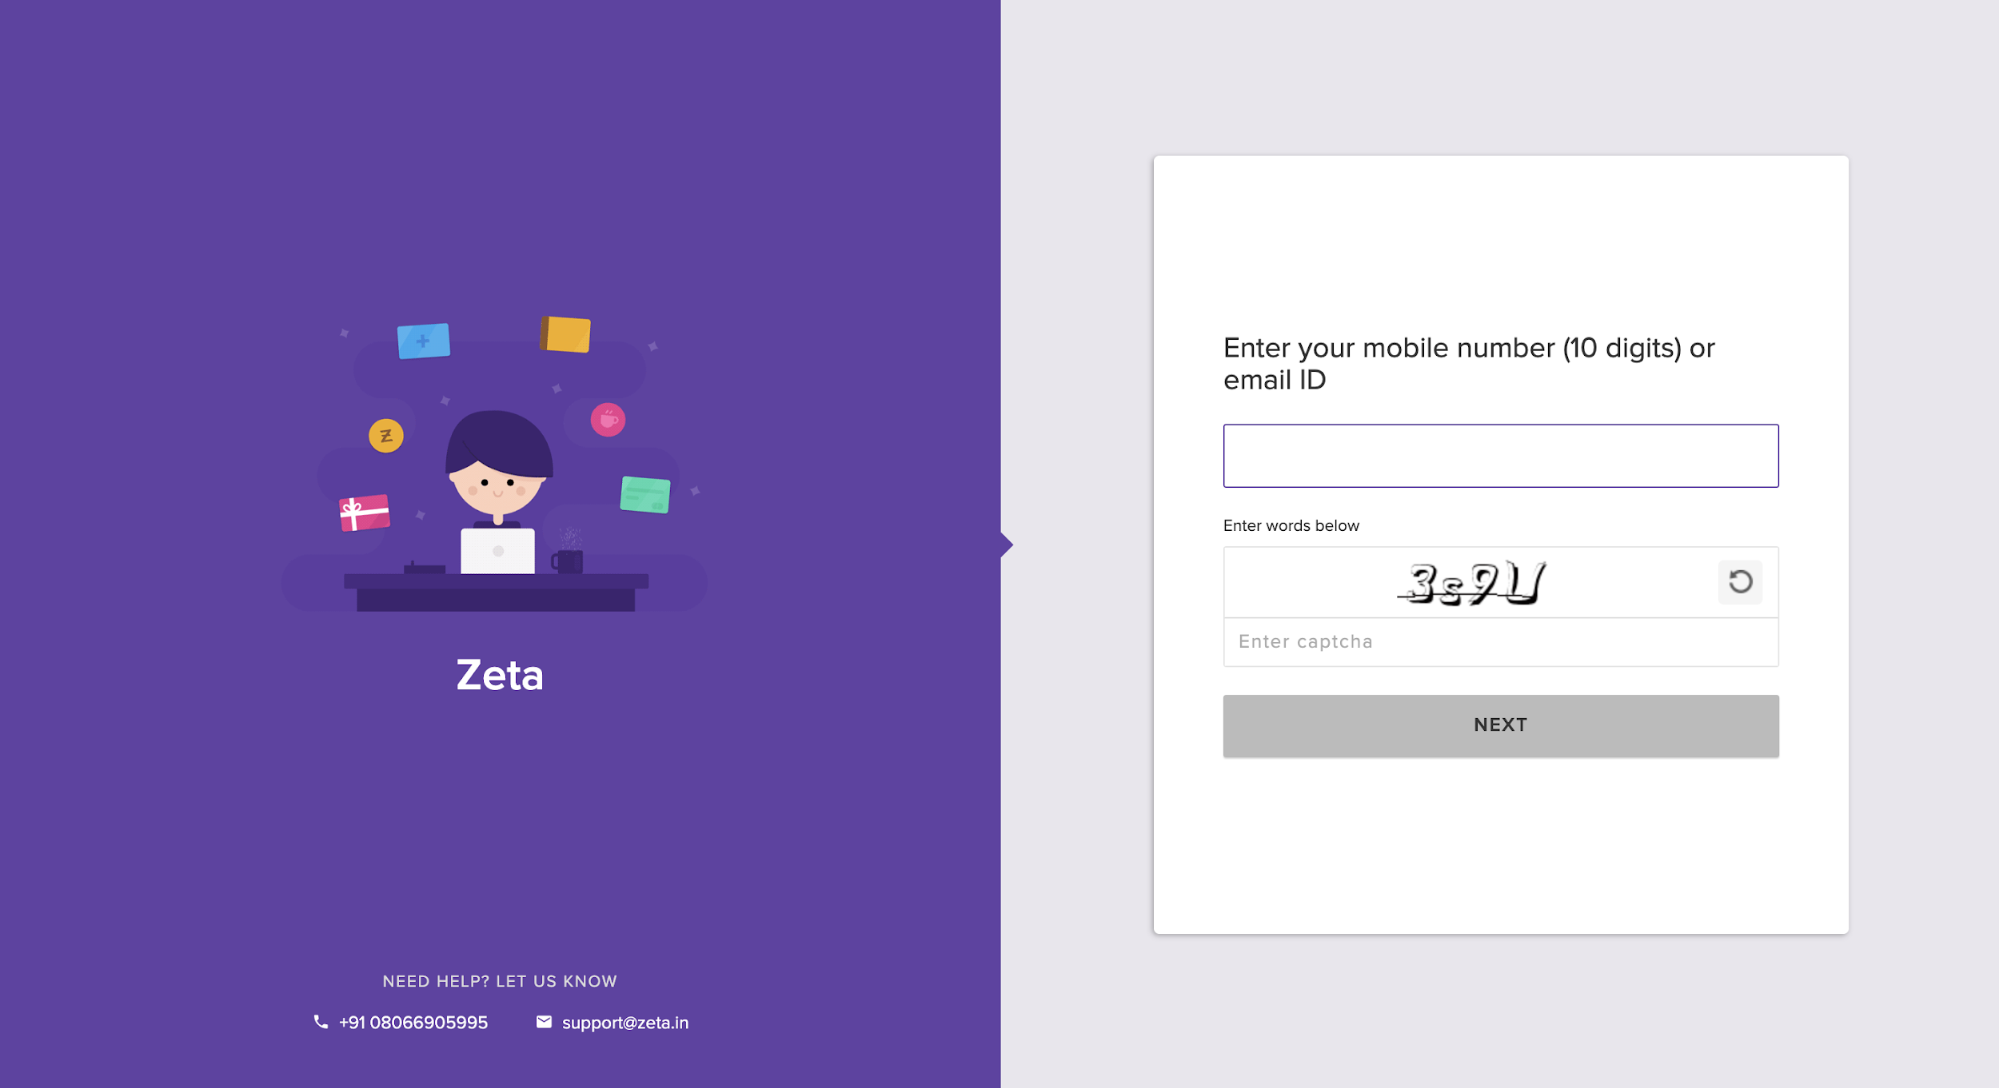
For logging in, you’ll have to go through the following steps:
- Enter your 10 digit phone number or email ID
- Verify using an OTP sent to the registered phone number
- Select Report Center on the landing page
Dashboard
Once you are logged in, you will see a few things on your dashboard:
- A list of report catalogs, report categories and reports that you can access
- In the left-hand side menu, you will see 3 sections:
- Report Catalog
- Generated Reports
- Schedules
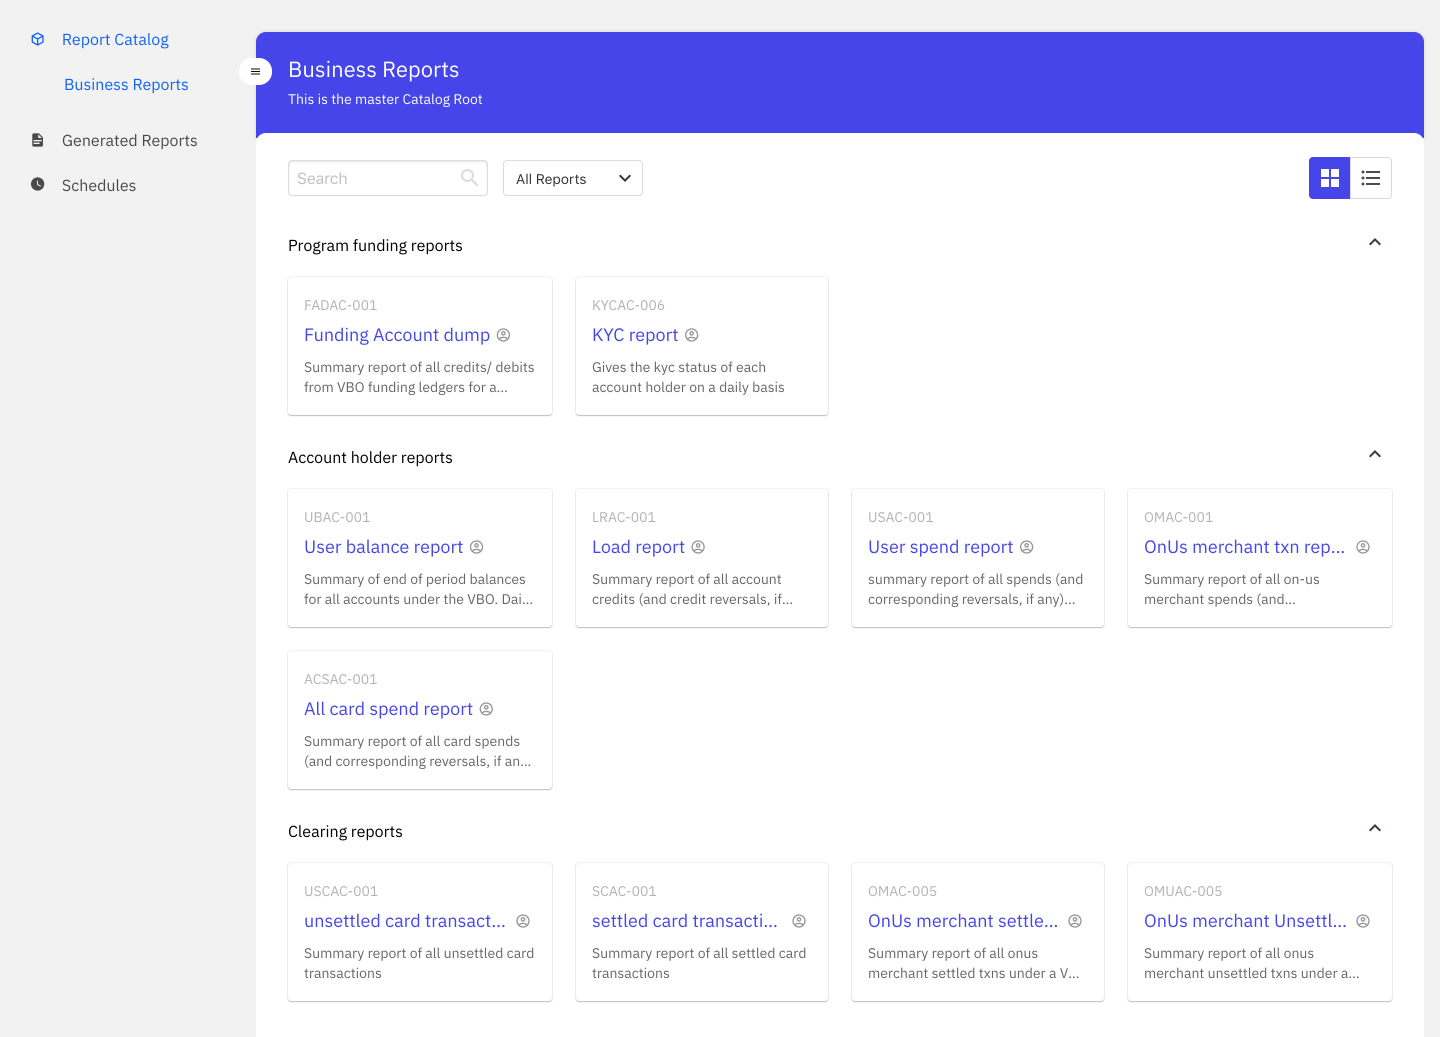
A Report Catalog is a collection of reports to help you better navigate and access all the reports available. Each report catalog consists of report categories and these report categories contain different reports.
Schedules shows you a list of all the created schedules against all the reports.
Generated Reports shows you a list of all the reports generated based on the schedules created.
Exploring Reports
The easiest way to get comfortable with the tool is by browsing through various reports and learning more about your data. Click on reports that you have access to on your own dashboard to dive into the data.
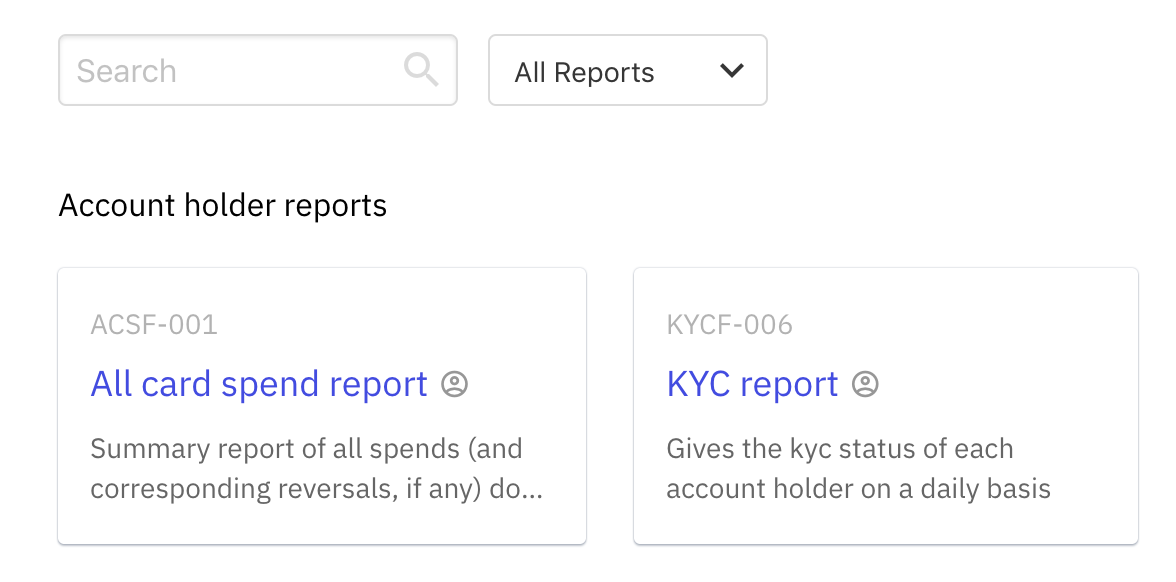
For every report, you’d be able to see the following:
- Report ID - A unique identifier for your report.
- Report Name - A title to help you identify the report.
- Report Description - Additional information about the report to help identify the purpose of the report.
In the below image, for the first report
- Report ID: ACSF-001
- Report Name: All card spend report
- Report Description: Summary report of all account credits (and credit reversals, if any)
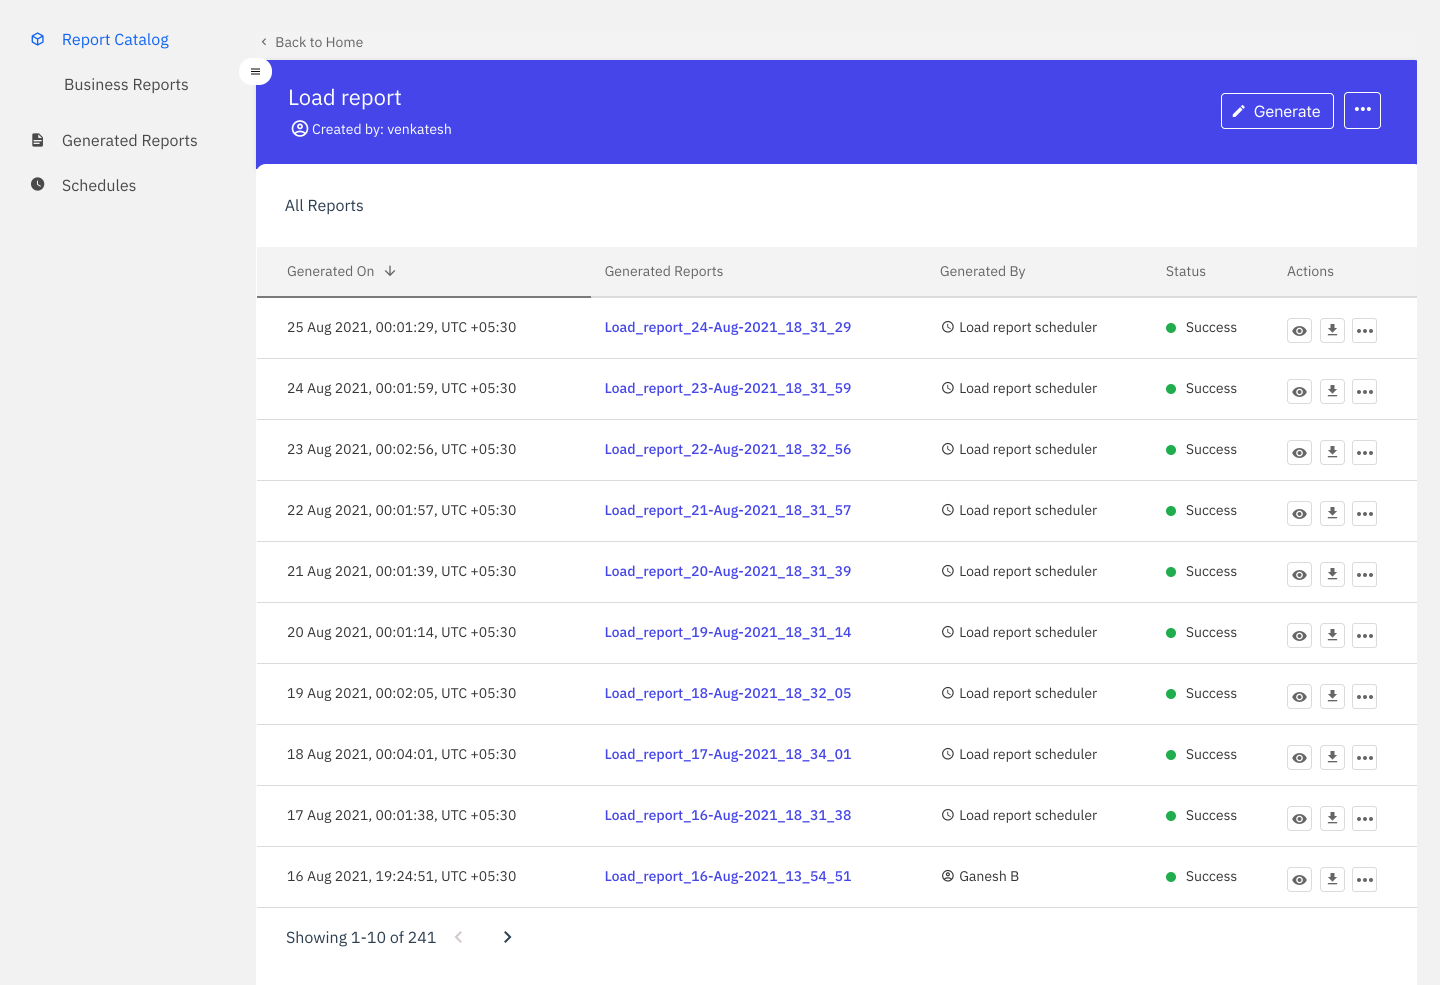
Once you click on a report on your dashboard, you’ll be taken to the page where you can do the following:
- Generate a report
- View all the reports generated till date for that Report ID
Generate a report
Once you navigate into a report of your choice, you can **generate a report **to view and download the report for further understanding of the data.
Once you click on Generate, you can modify different parameters relevant to the report. The workbench enables you to do the following:
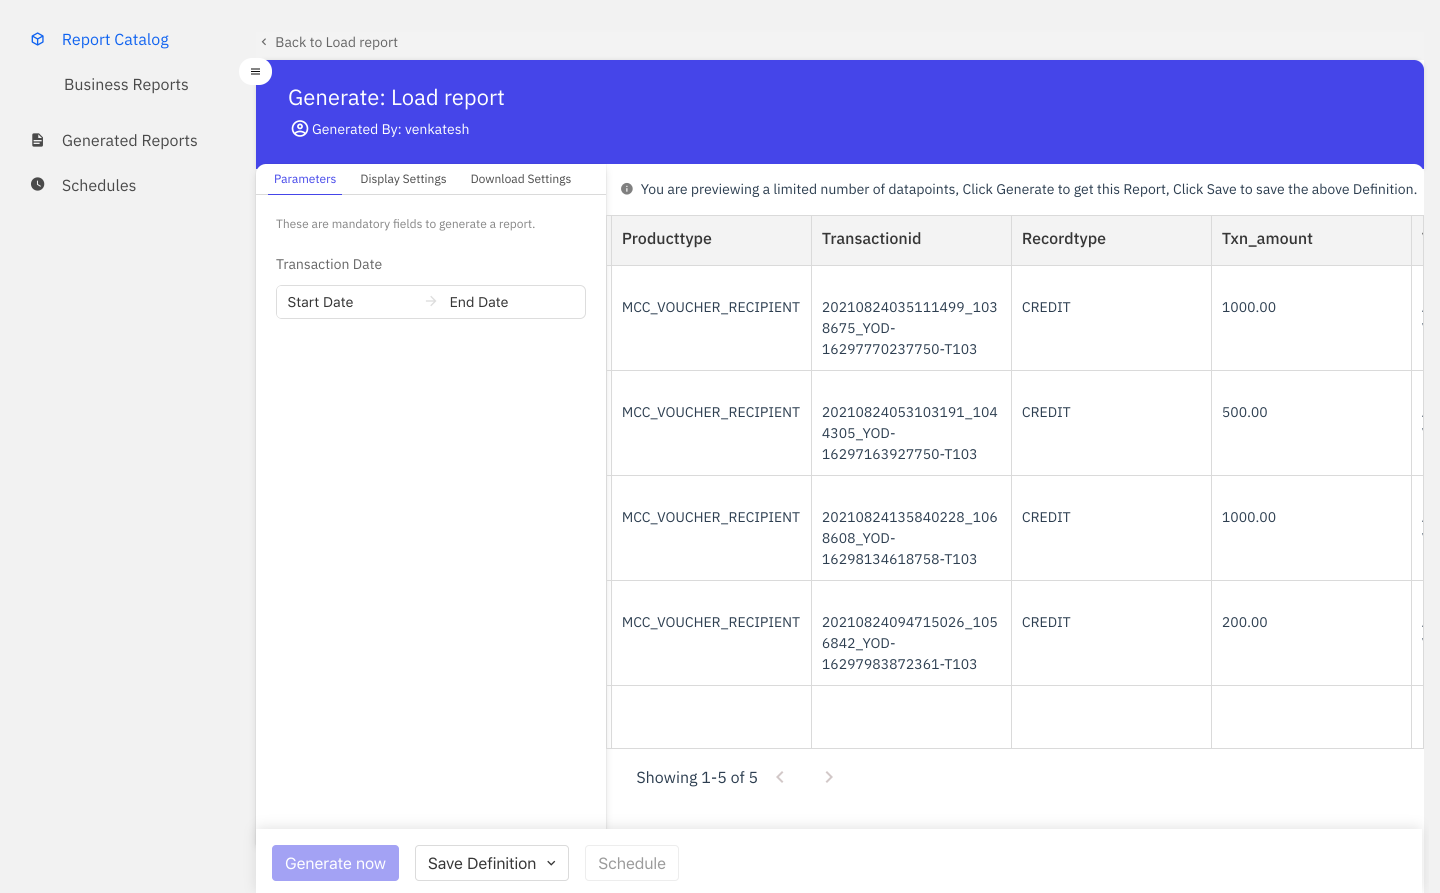
- Modify report filters - A Report filter allows you to filter the report data based on certain conditions. You can modify the values of the filters that will be applied to your report when generating. In the below given screenshot, you can modify the Transaction Date and this filter will be applied when the report is generated.
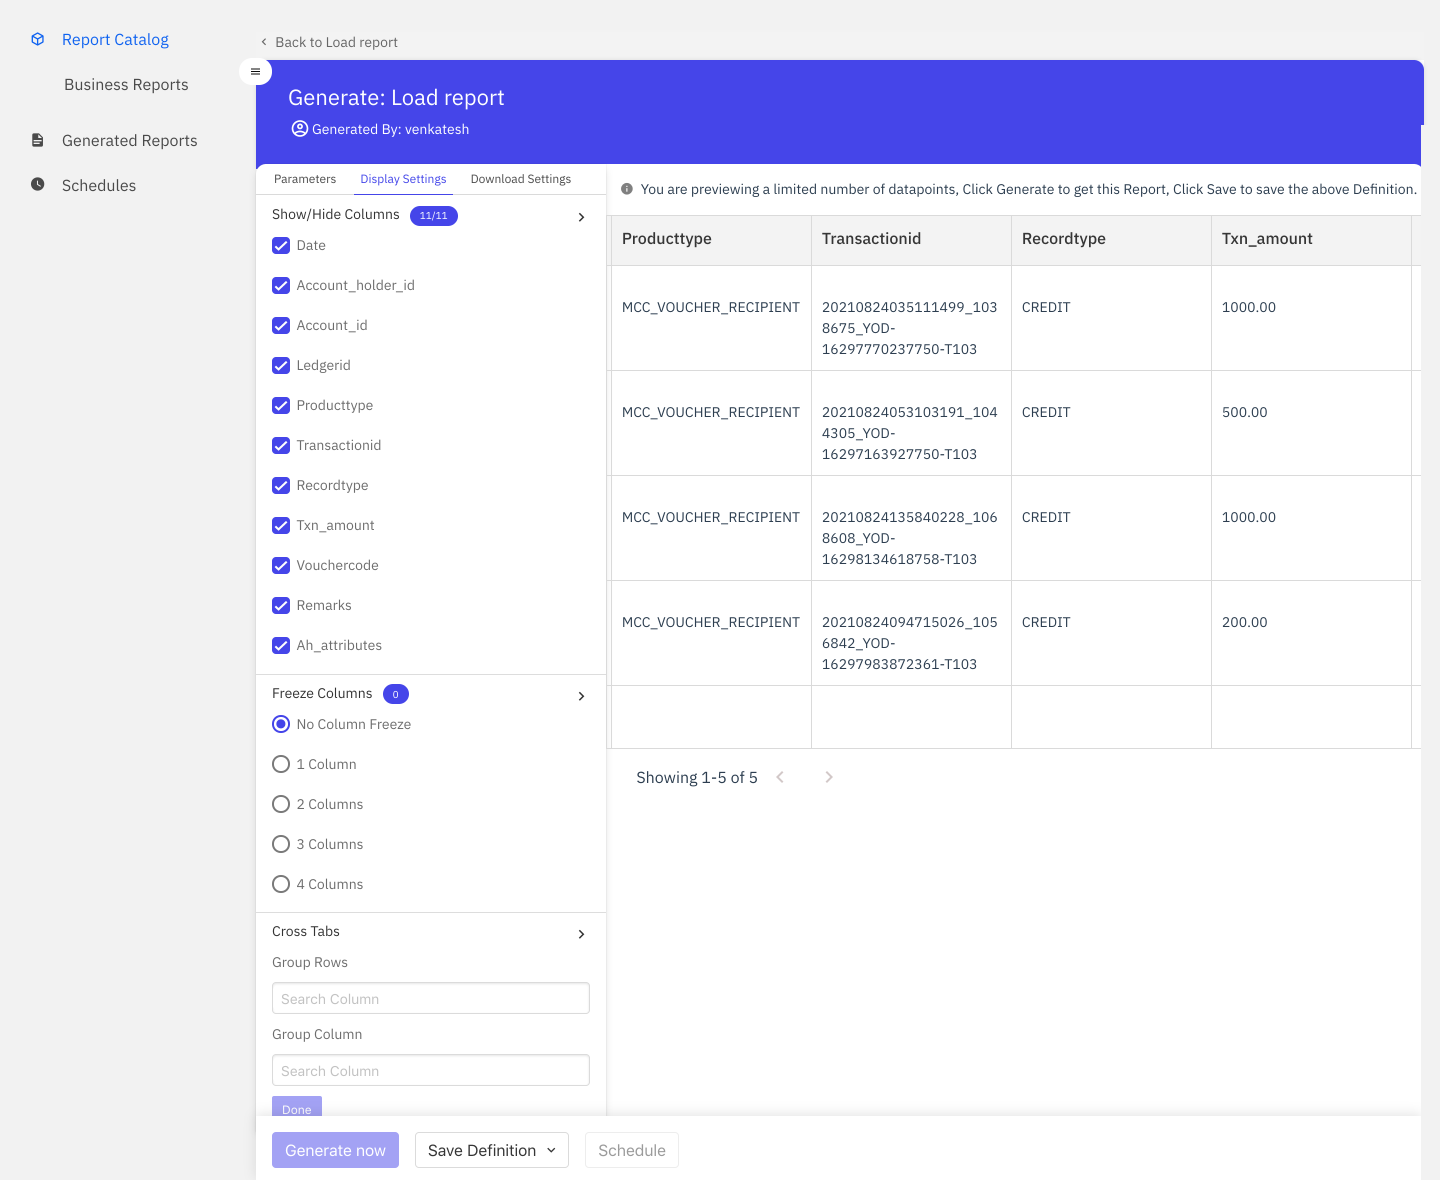
- Modify display settings - You can change how the report is displayed when generated. You can change the following attributes:
- Show/Hide Columns - You can choose only a particular set of columns to be displayed in the generated report.
- Freeze Columns - You can use this to pin specific columns in the report during scroll while viewing the generated report.
- Cross Tabs - You can use this advanced feature to view the generated report as a Pivot. You can specify the rows, columns for grouping and the values to be shown in a generated report.
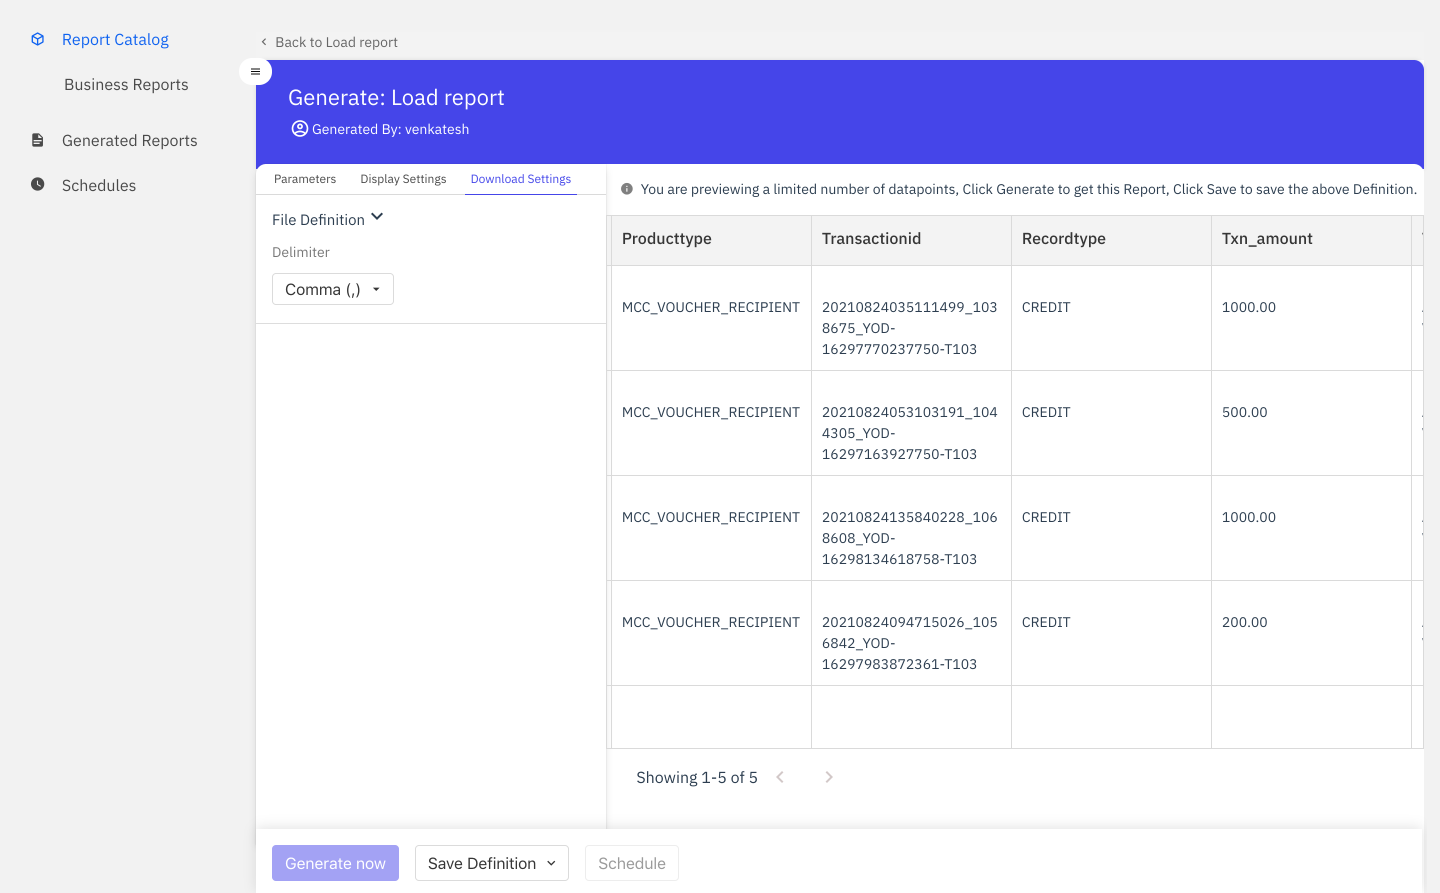
- Modify download settings - You can view the data separated by the delimiter of your choice. While generating reports manually or through a schedule, you can now select different separators under the download settings. The supported separators are comma(,), pipe (|), and semicolon(;).
- Save your report definition - You can either overwrite the existing saved report (with Save) or save it as a new report (with Save As).
- Generate a report - You can generate a report with the given report definition.
You can also reset all the display settings to default values.
All the reports generated can be viewed from the following sections:
- You can view a particular report definition specific generated reports by clicking on the report on your dashboard.
- You can view all the generated reports across all report definitions from the Generated Reports section in the left-hand side menu.
Things to note
- You can only modify the pre-configured reports on your company’s domain. New report definitions can be requested via Fusion’s business operations team.
- While viewing the reports, the workbench loads a maximum of 2000 rows for a report irrespective of the number of rows in the report to provide you with the best experience. If you want to view the full report, you have to download the report.
- When saving a new report definition, the Report ID has to be unique.
- A report should ideally load within a few seconds. In the case that it takes longer, please check your network connection or reach out to your admin.
Create/Update a schedule
Once a report has been saved, you can create a schedule. A Schedule will auto-generate a report for a given set of report filters on a daily, weekly or monthly basis. On generation, these reports can be automatically sent to a given list of email addresses or uploaded to the SFTP server. With schedules, you can conveniently view these reports without having to login to the Report Center.
To create a schedule, you go through the following steps:
- Once a report is saved, click on Schedule.
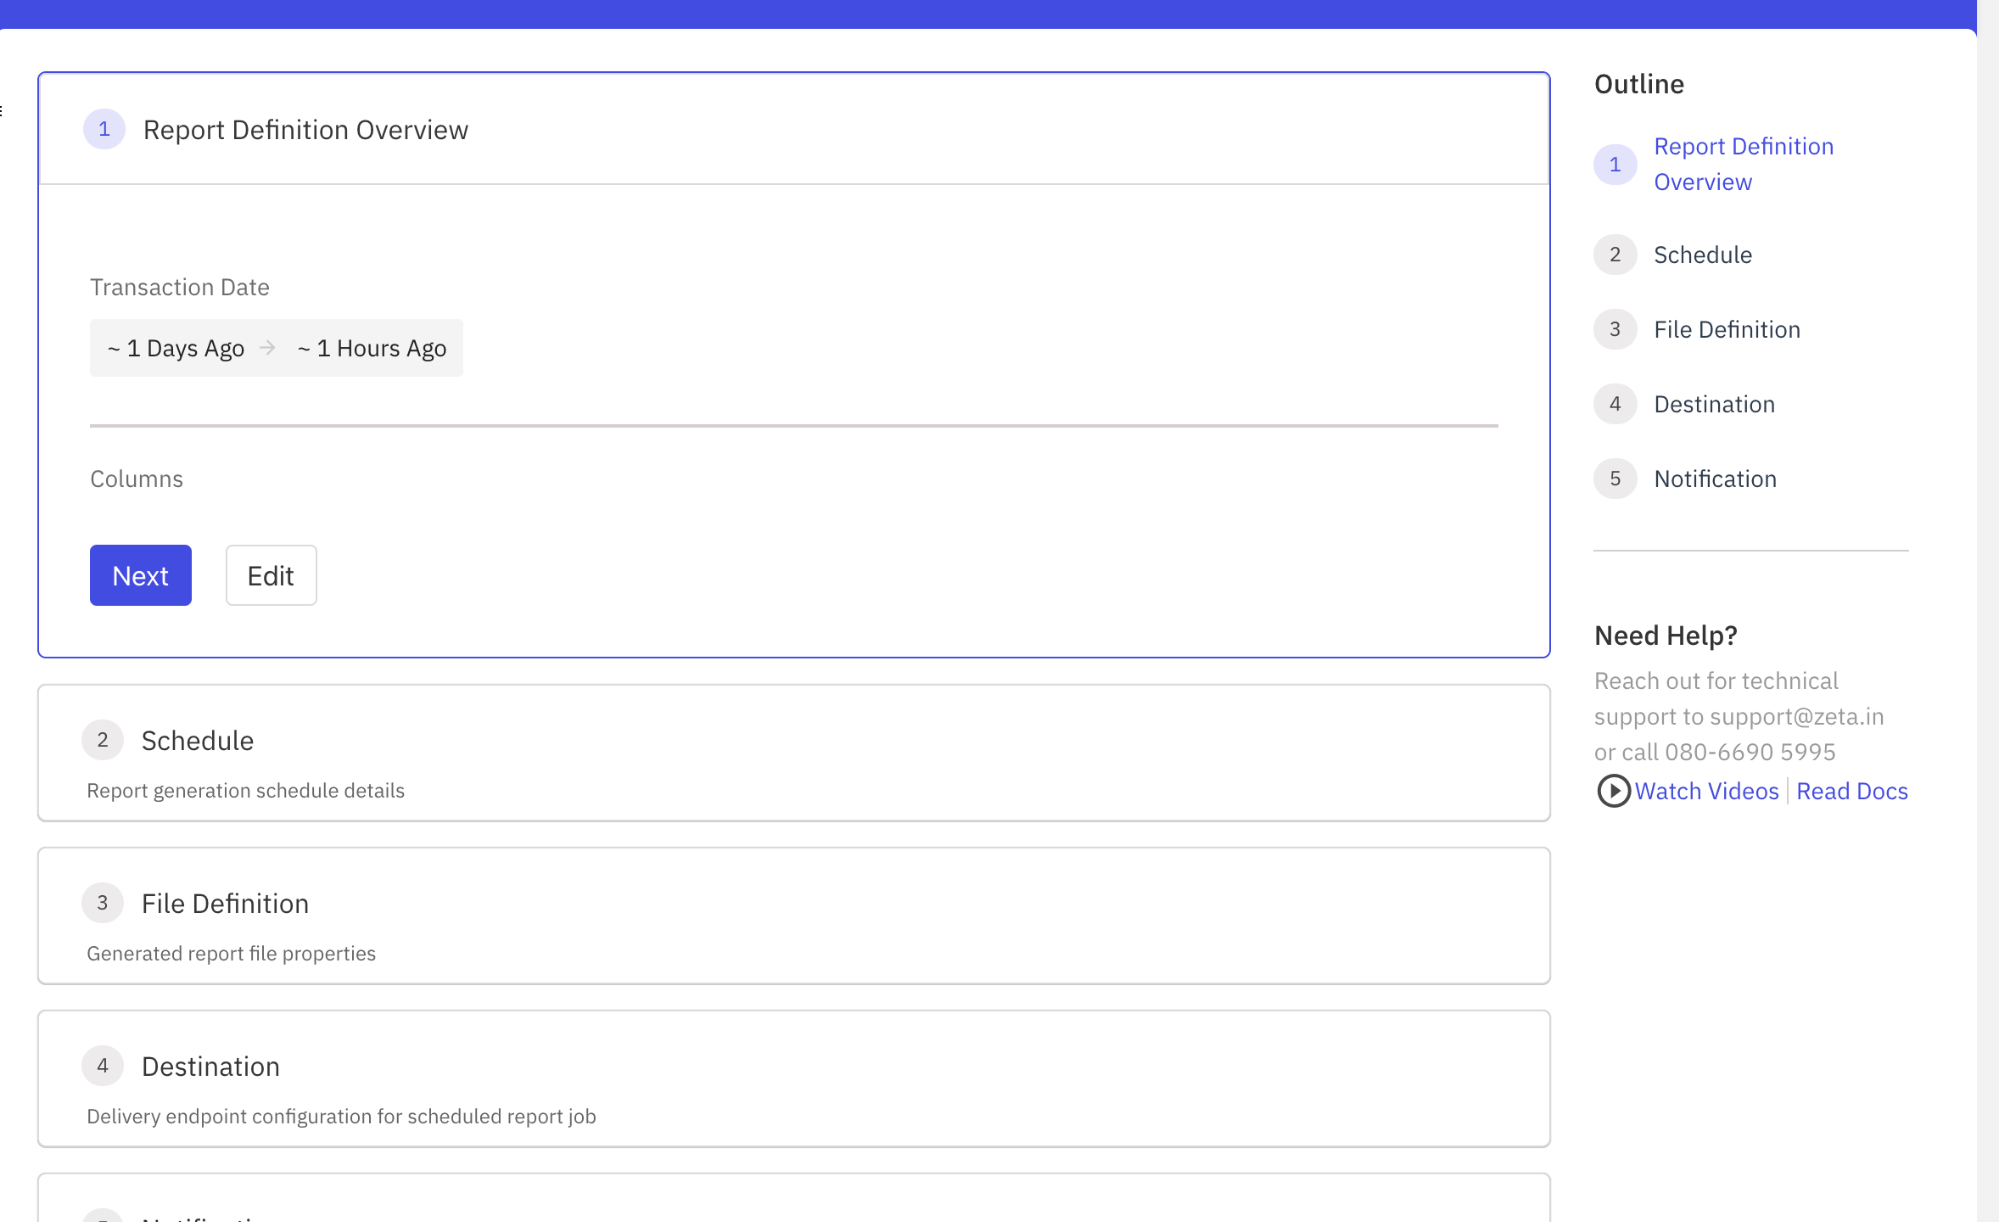
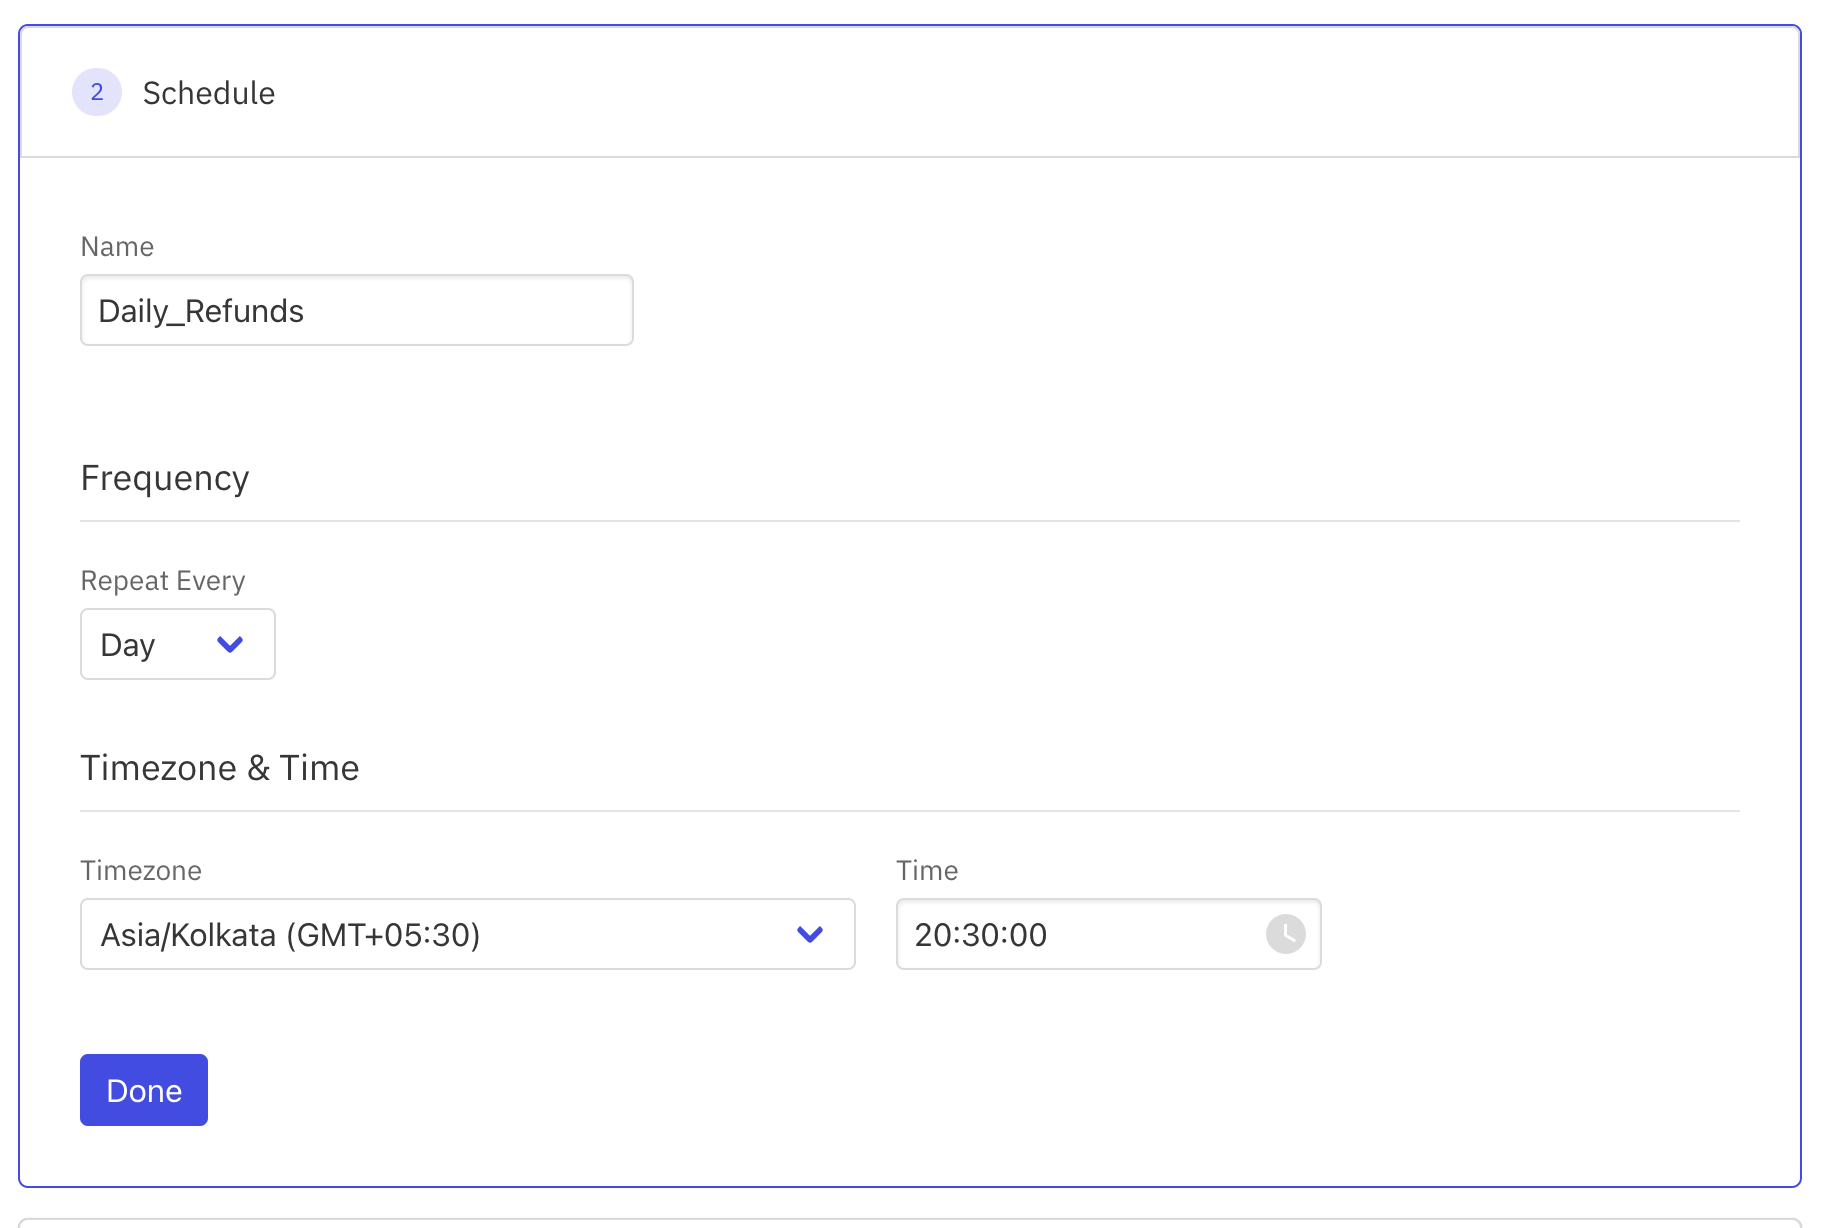
- Choose the schedule for your report. You can choose to have a schedule daily, weekly or monthly. You can also select the timezone and specific time of day to generate the reports. For better managing these schedules, you can give this schedule a name.
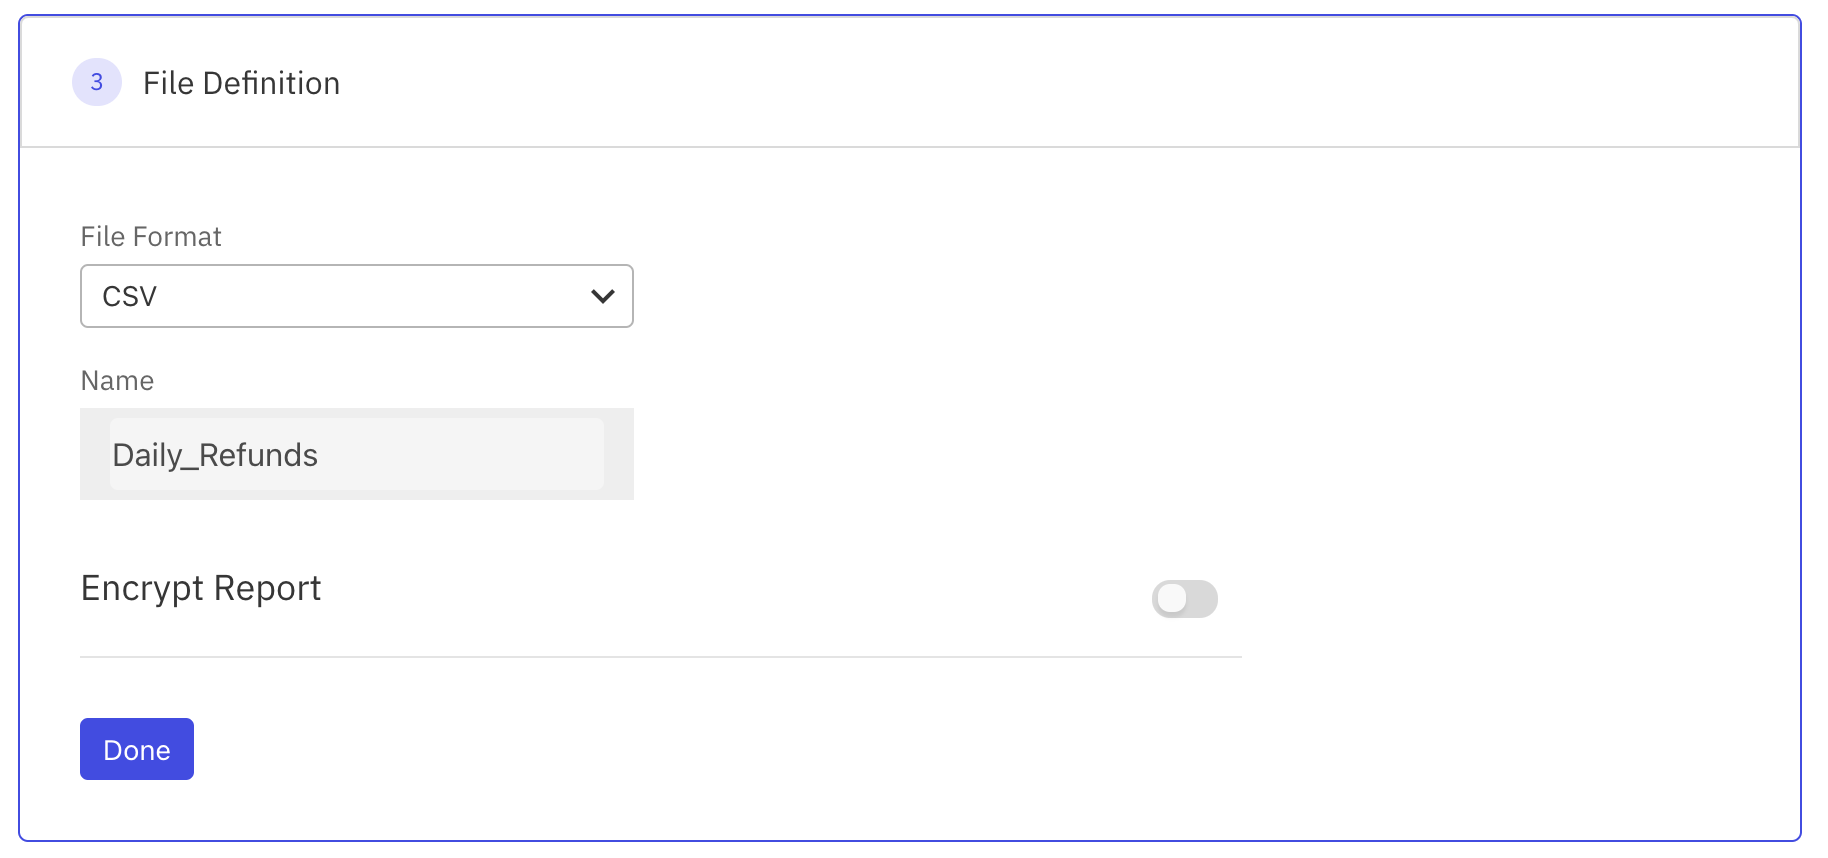
- You can choose what file format you want the delivery to happen in.
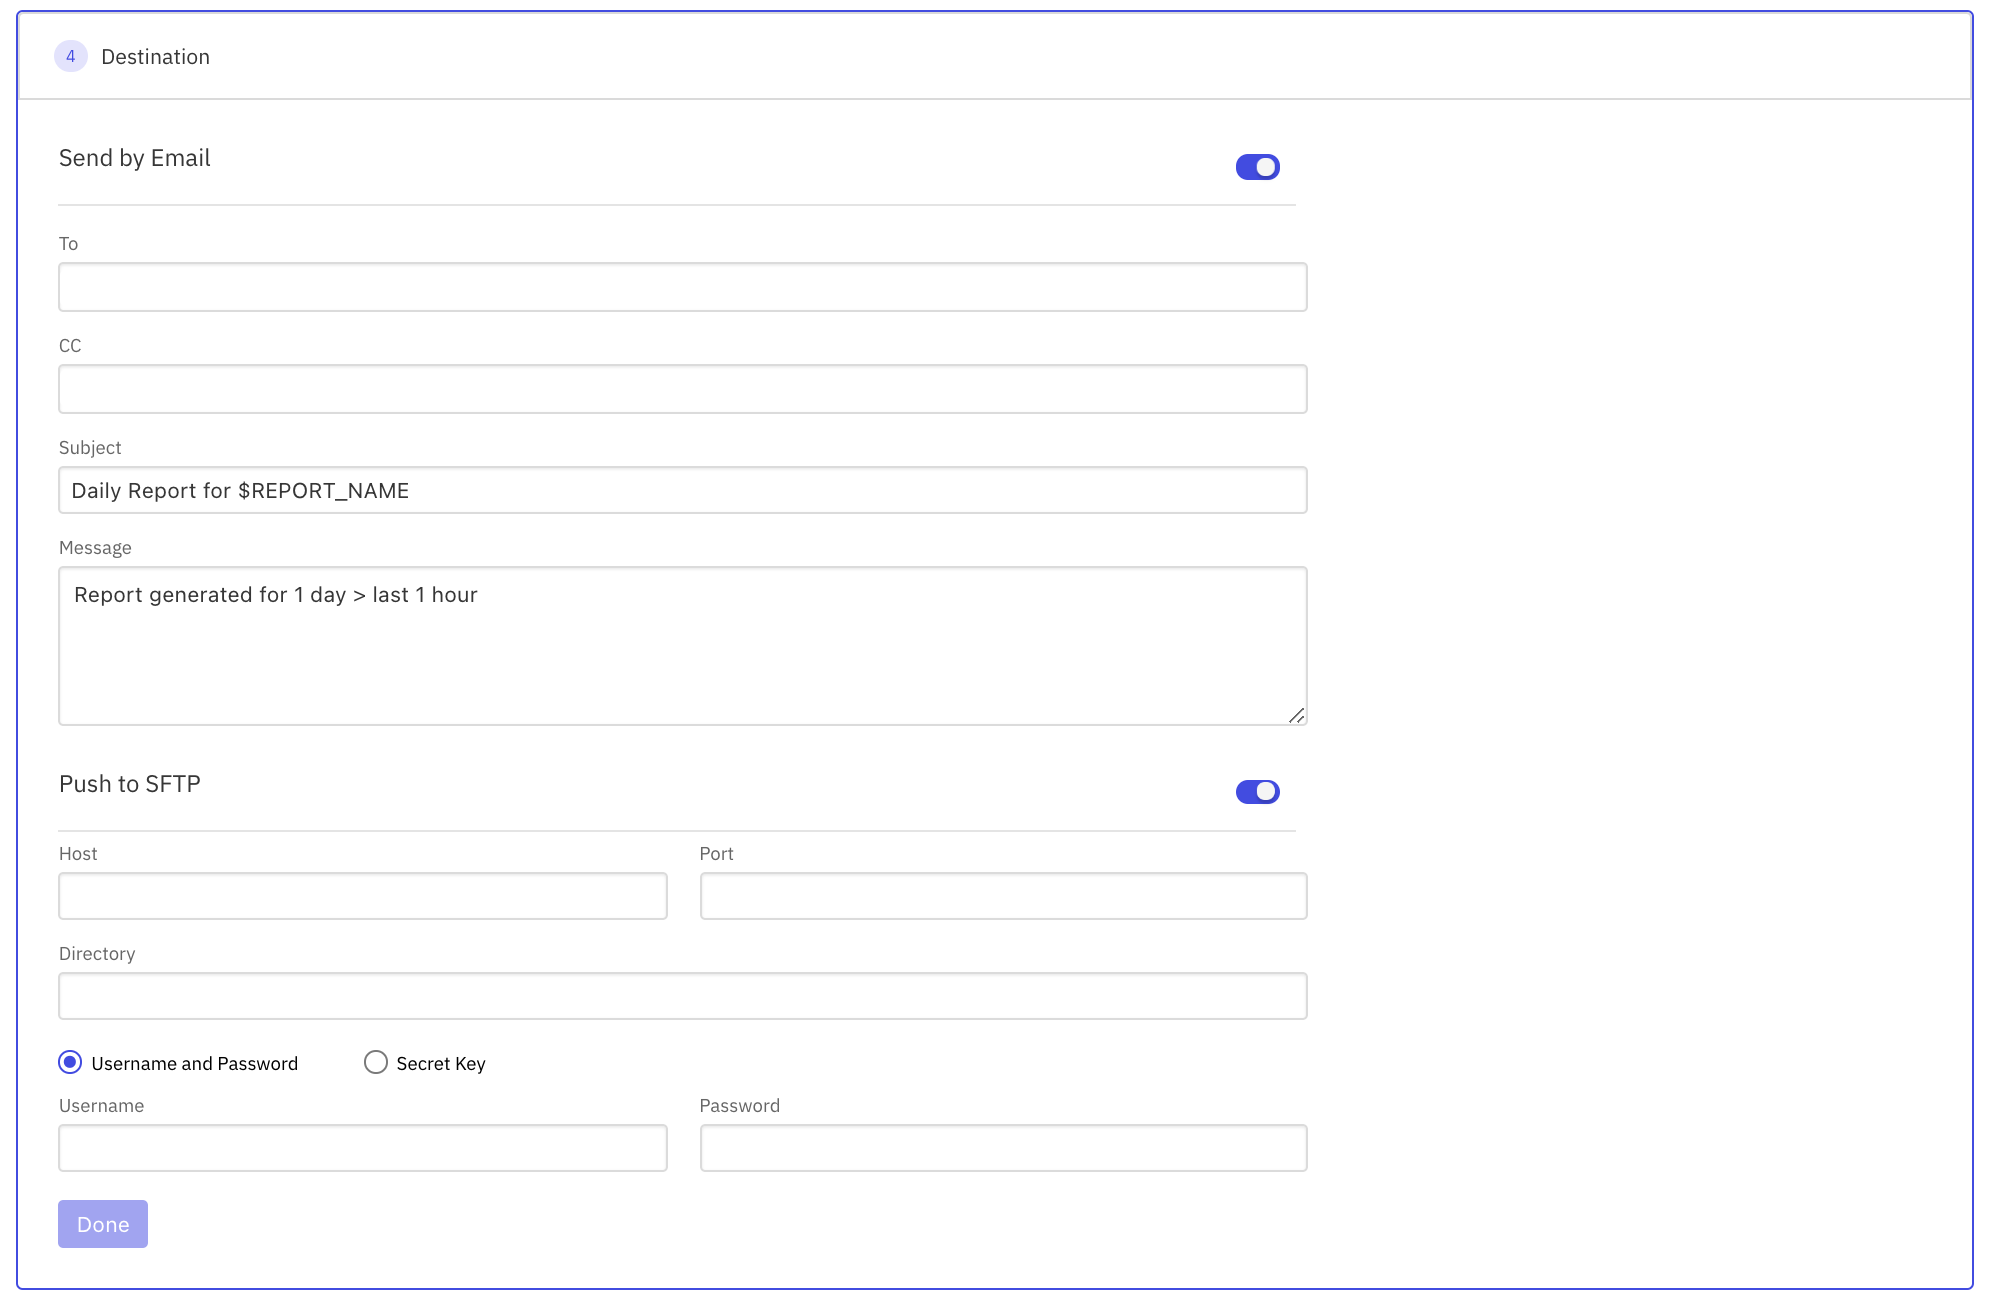
- You can then select how you would want the delivery of the generated report to happen. You have the following options:
- Send the report by email - You can customize the email template and the recipient addresses.
- Upload them to SFTP server - You can specify a particular host, port, directory along with any relevant authentication details for file upload. You can provide the following set of details with respect to the SFTP server:
- Host
- Port
- Directory
- Authentication
- Username and Password
- Secret Key
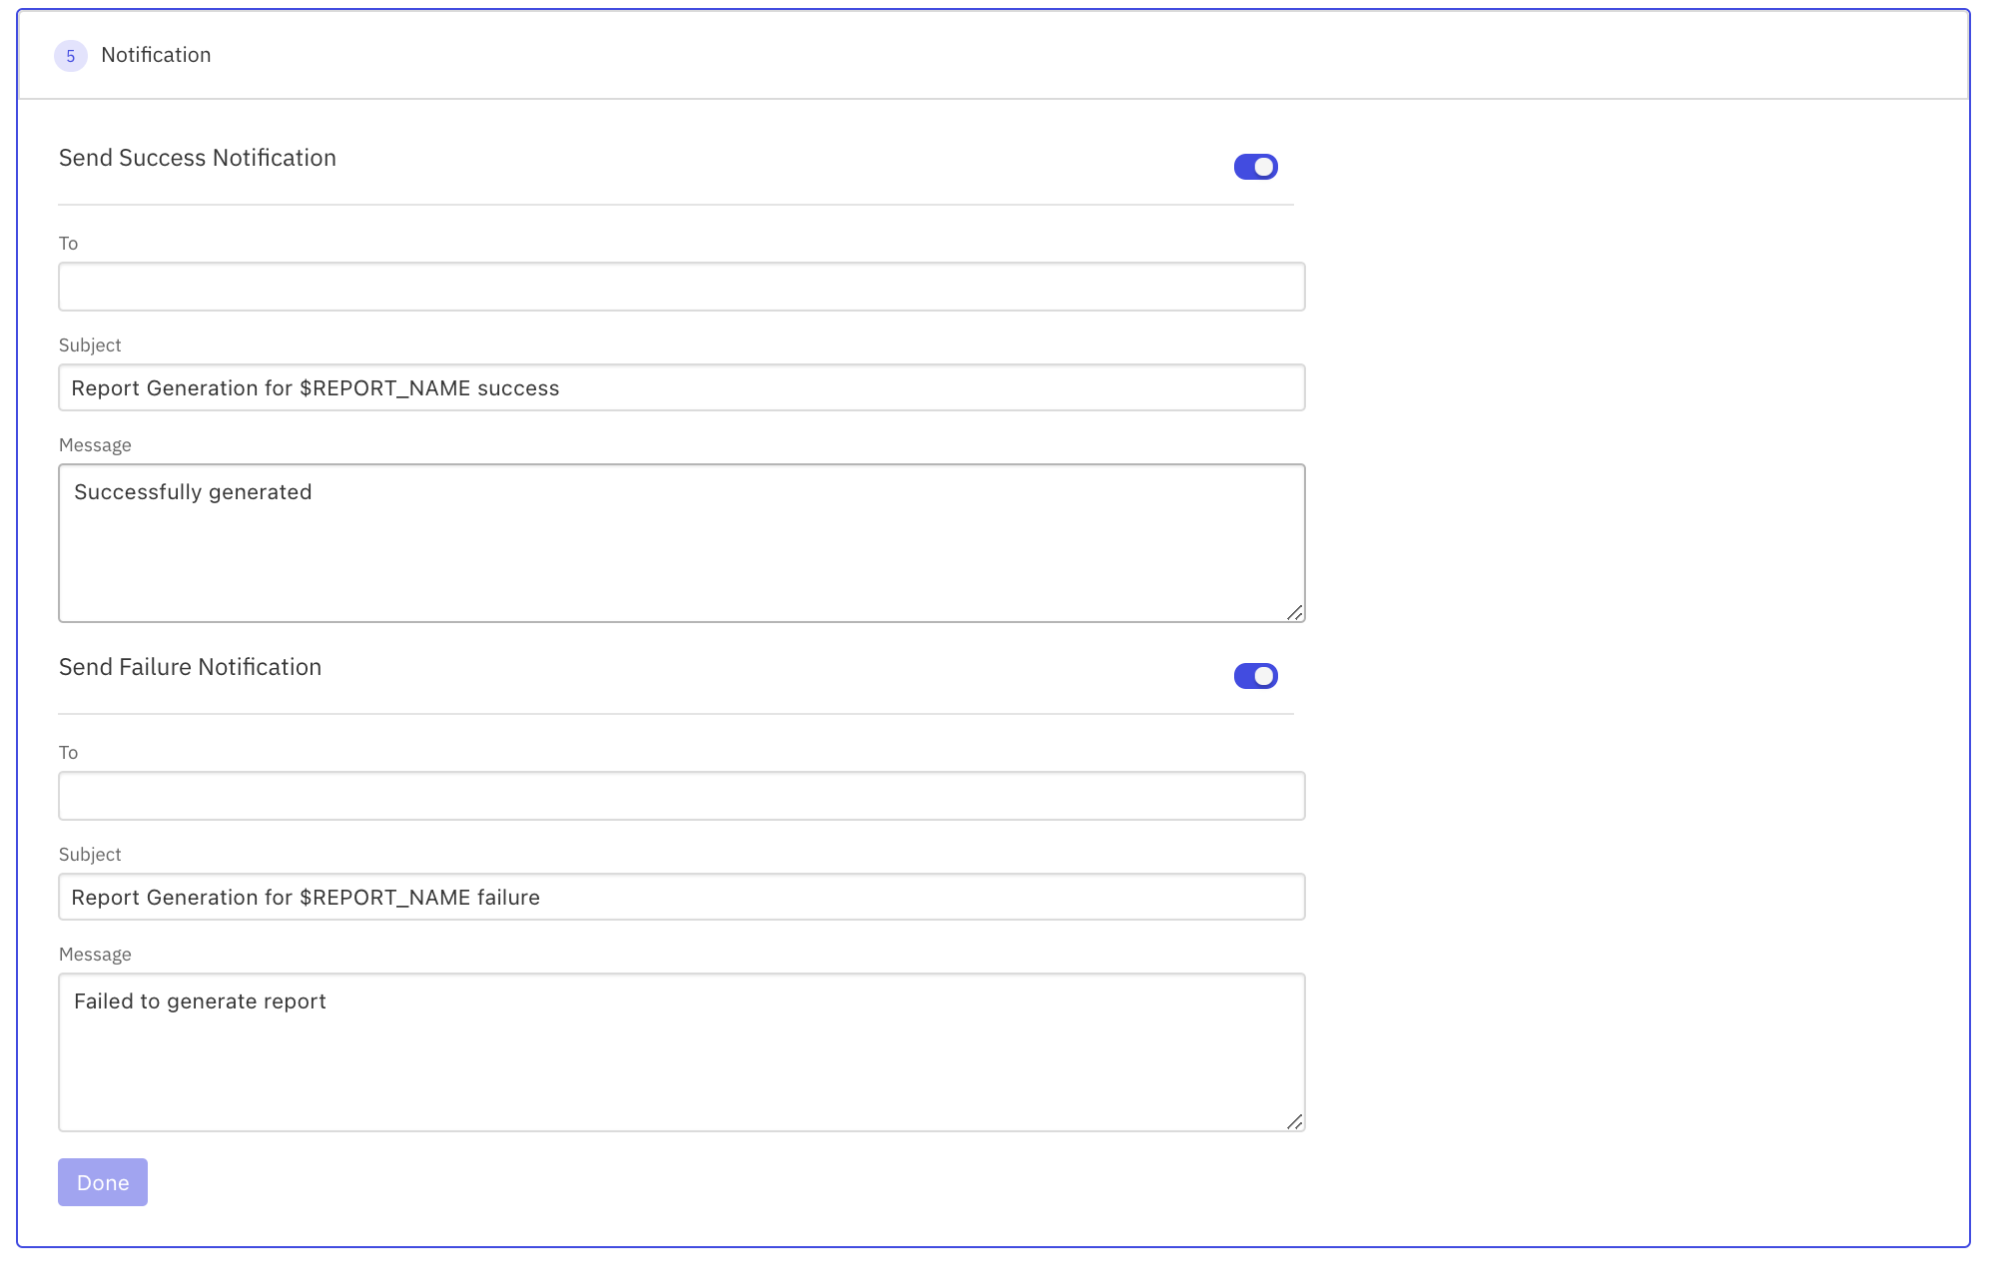
- You can also receive notifications whenever the report generation is successful/failed. You can customize the recipients of these notifications and the template.
Voila! And you are done. Once a schedule is created, you can see all the schedules from the Schedule section in the left-hand side menu.
Furthermore, you can always edit/deactivate a schedule from the Schedules page if you no longer want the generation of the report to happen automatically and be delivered to your email/uploaded to the server.
Leave Feedback
If you’d like to leave some feedback/have any suggestions on the Report center, please submit a response here.