What is Performance Center ?
Performance Center is an application performance monitoring tool , which will enable teams to track and monitor status of their SLAs in one place on a near real-time (with a delay of approximately 30 mins) basis. It also provides access to logs that helps teams in troubleshooting and debugging their applications. We plan to provide fintechs access to their API statistics and logs by extending performance center privileges to them.
Getting Started
Logging In
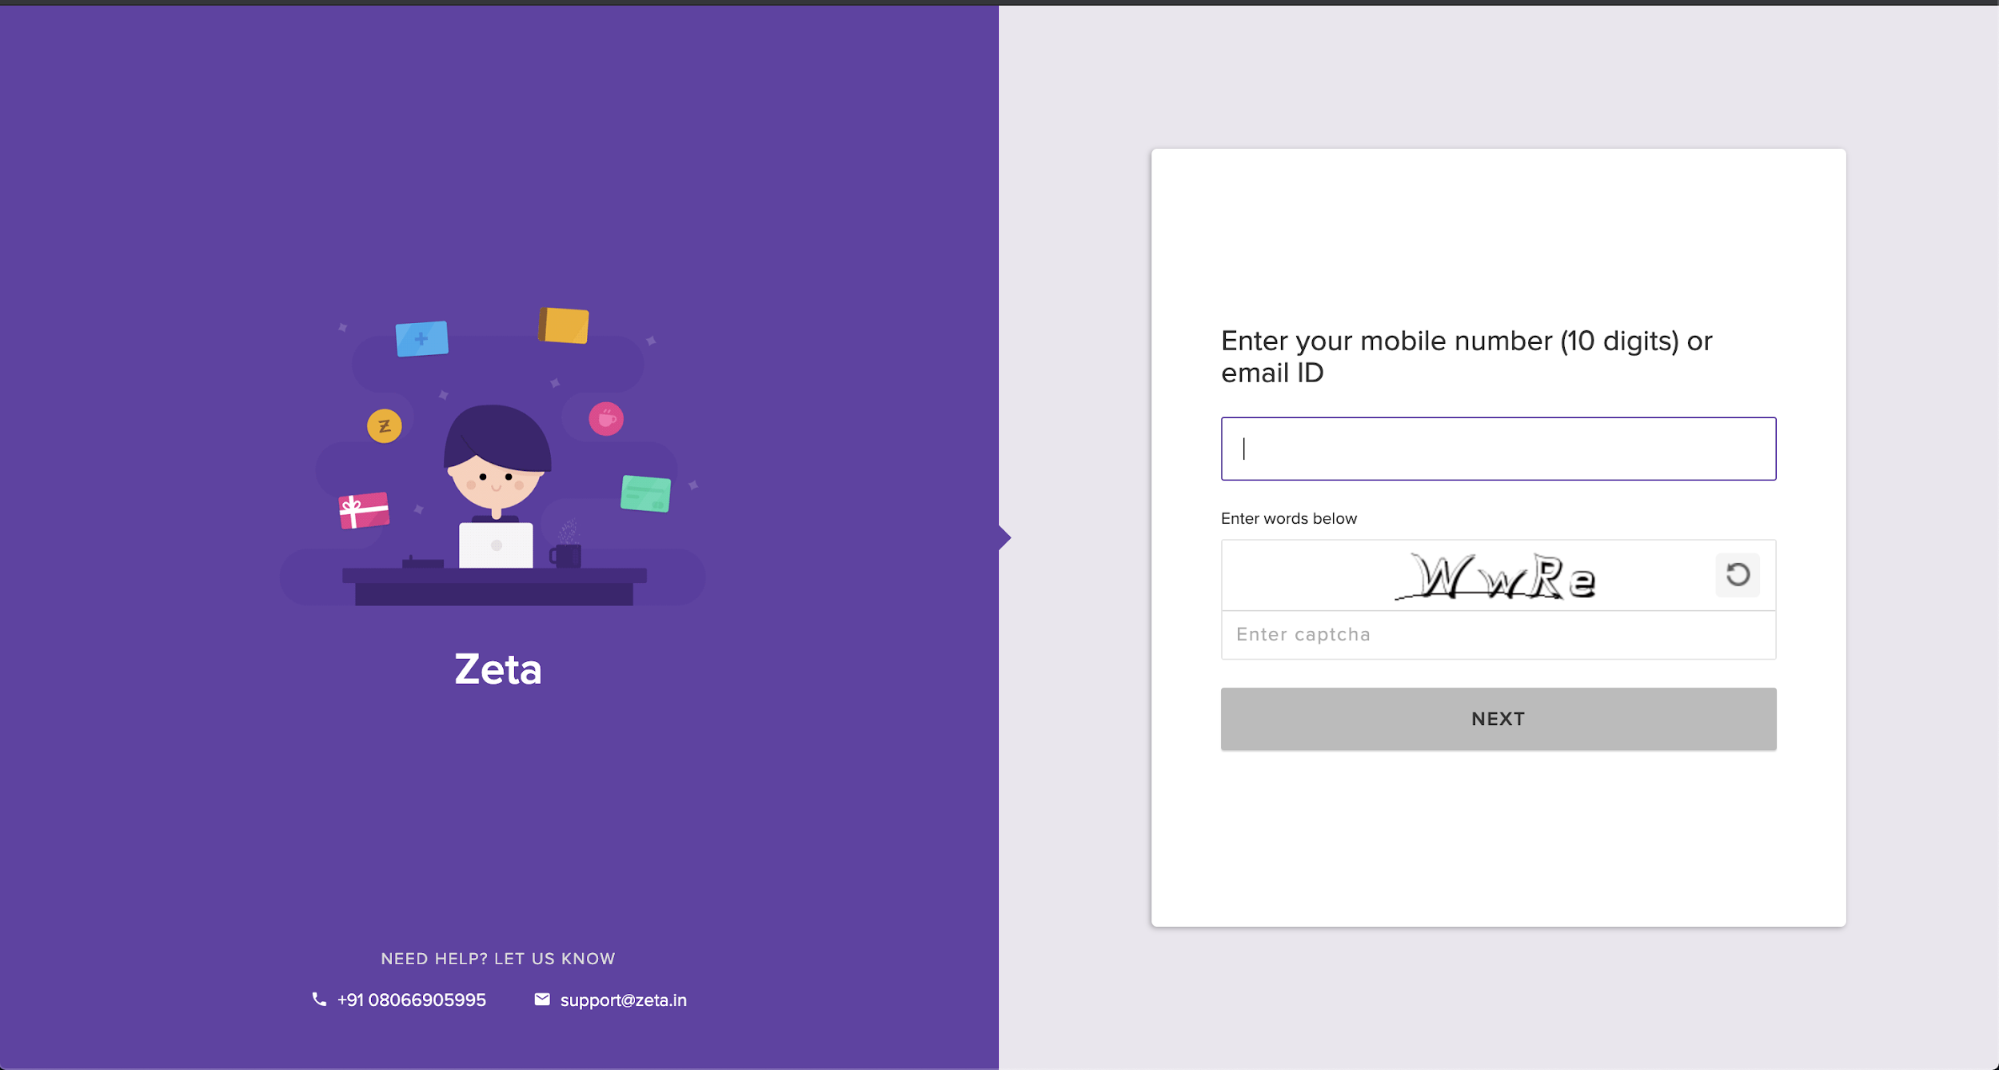
Fintech developers/executives with access to an instance of Performance center can login to it via FMC:
- Entering their 10 digit phone number or email ID.
- Verifying the identity via OTP sent to the registered phone or email.
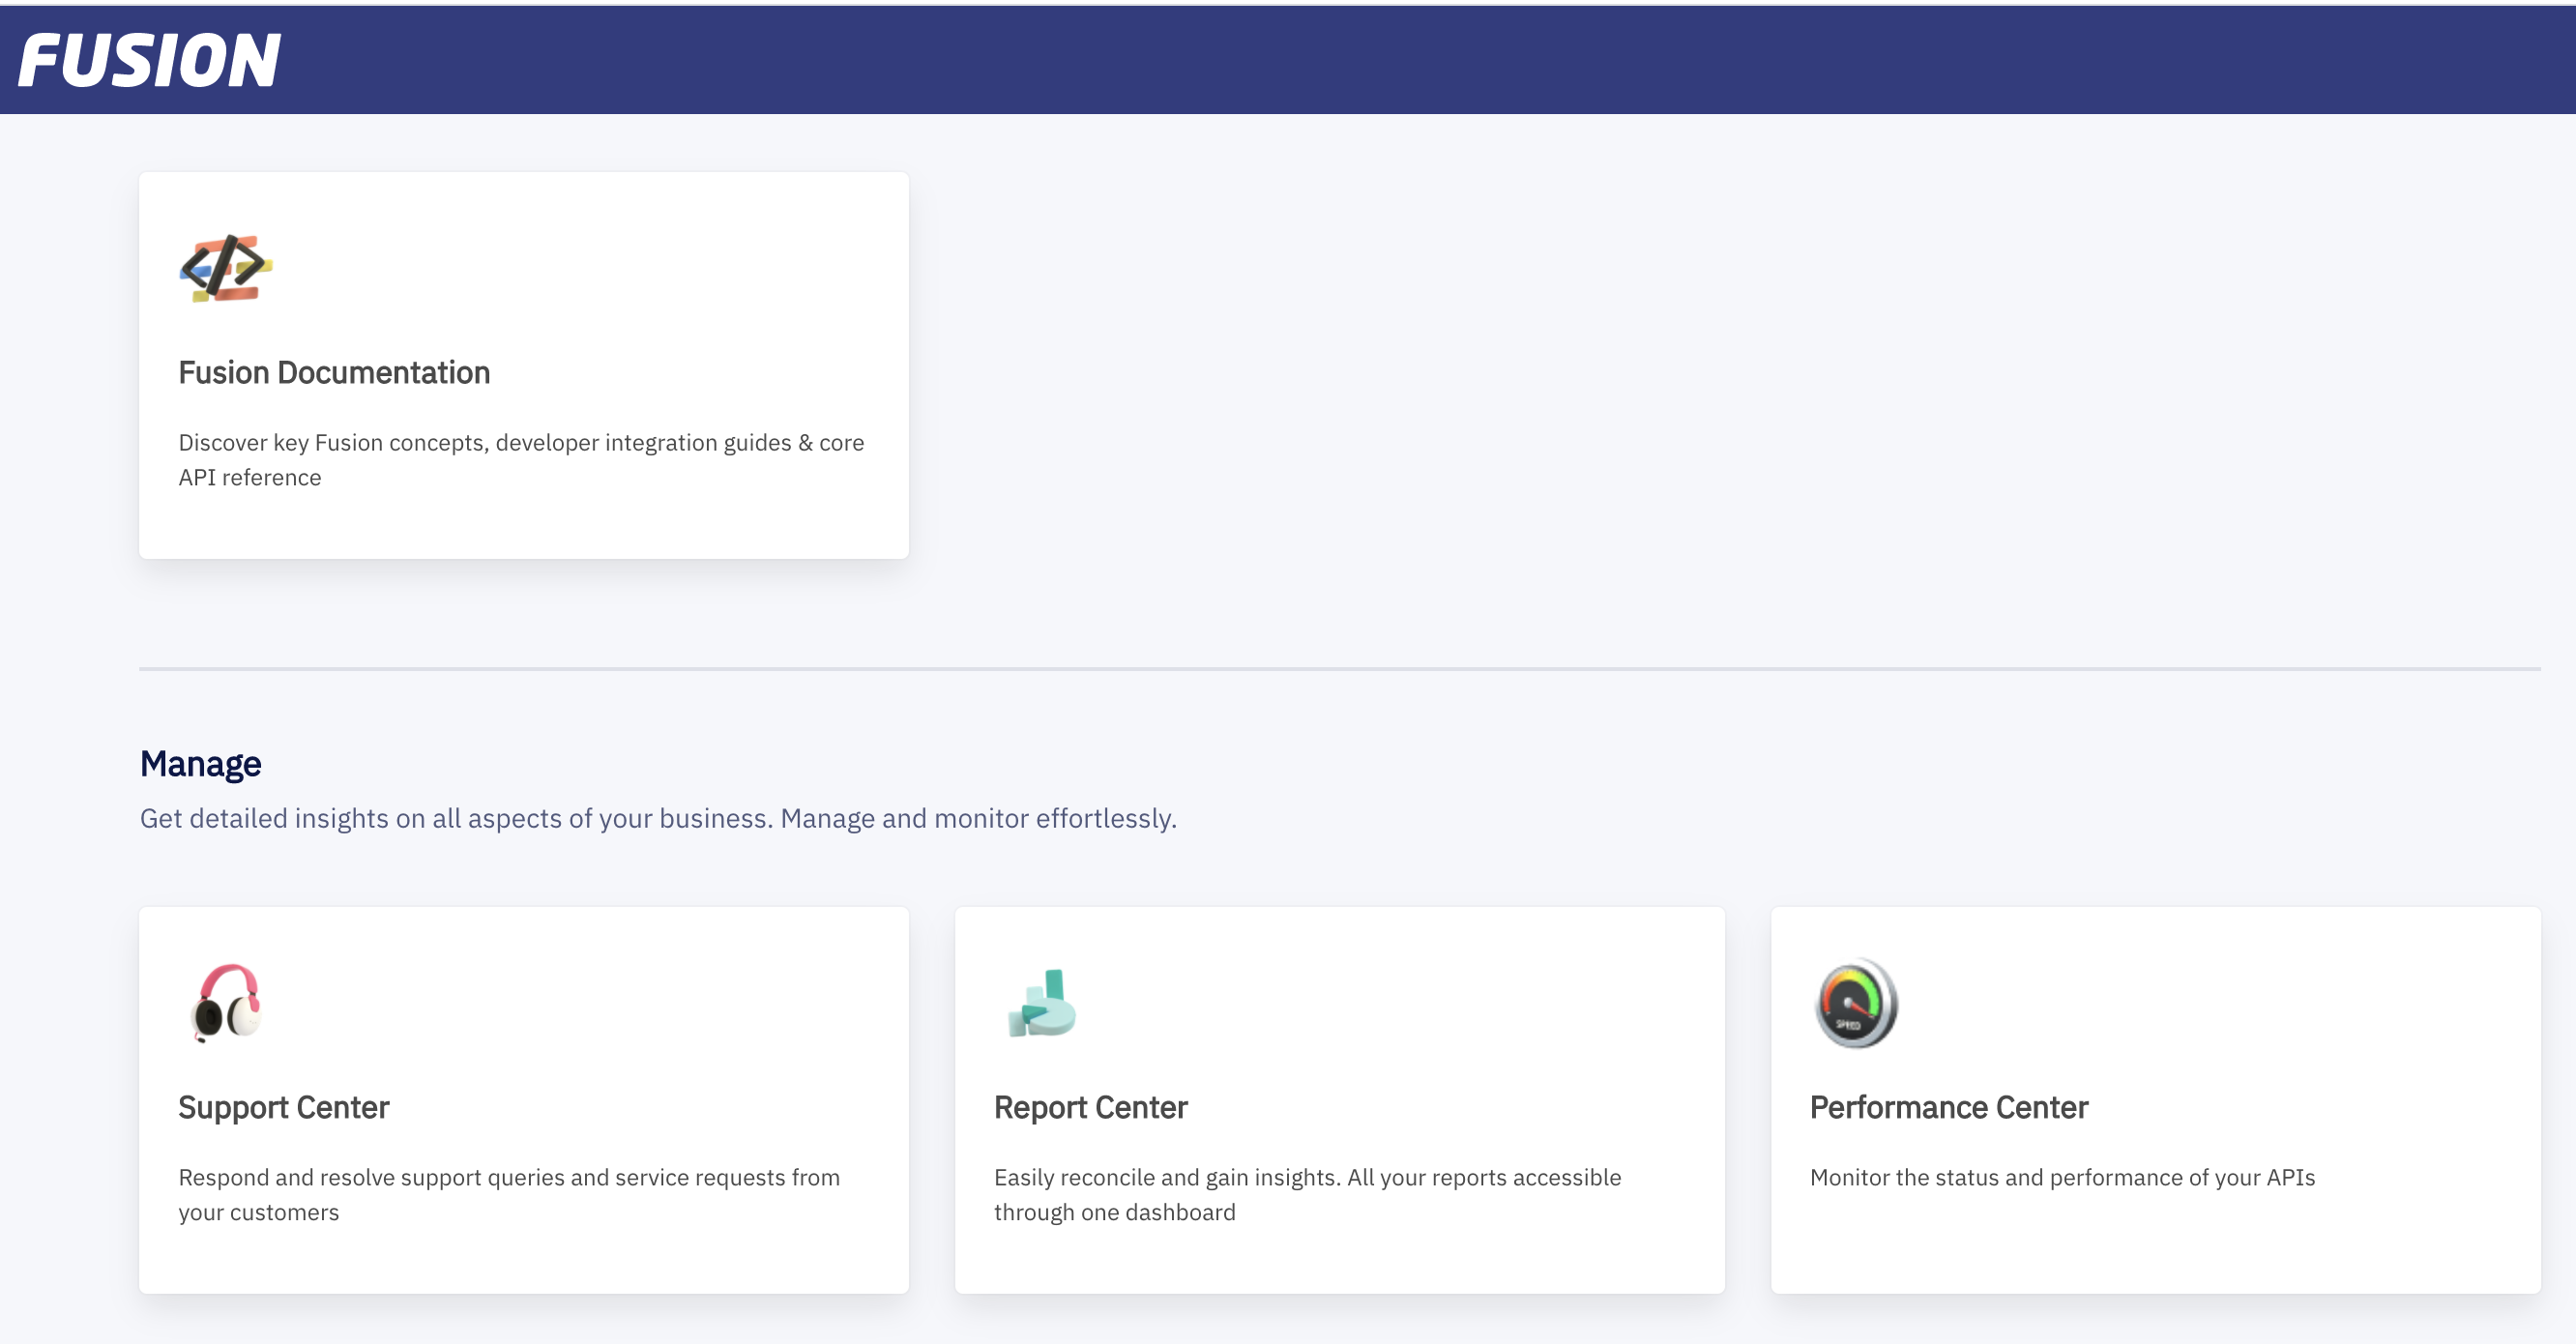
FMC Landing Page
Once you successfully login, you will be shown the Fusion Managment Console landing page.On the FMC landing page, you will see an icon for performance Center.You can click on the Performance center tile and you will be redirected to Performance center landing page.
Landing Page & Dashboard Search
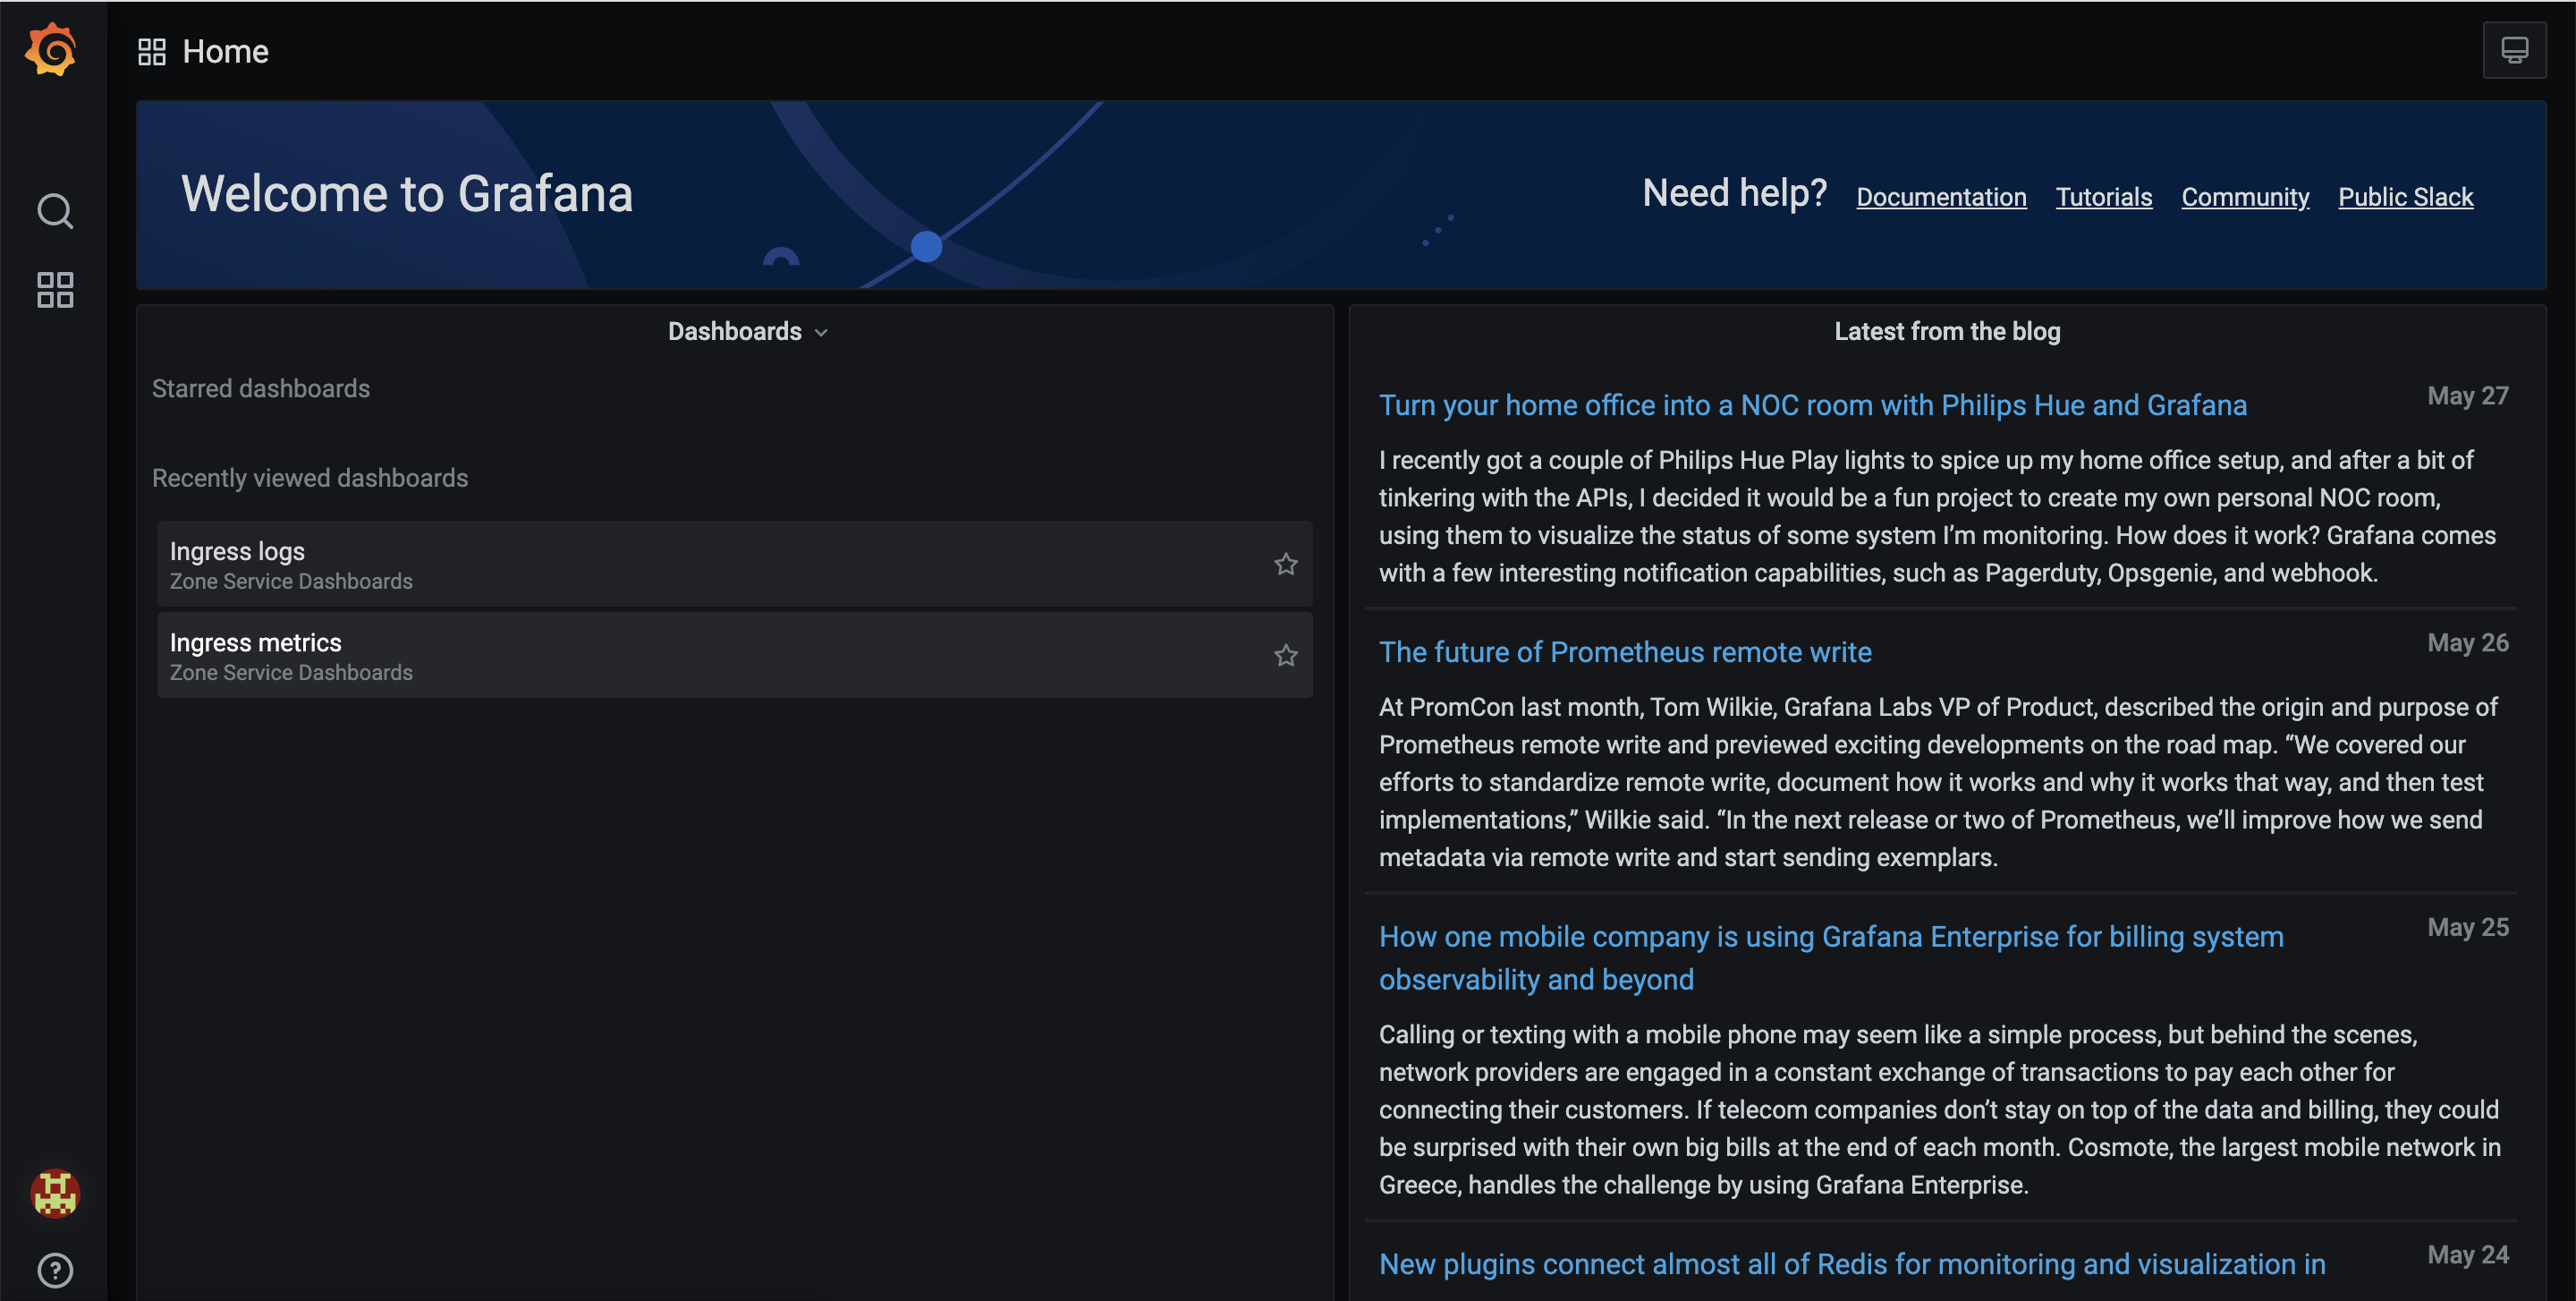
Default Landing Page
On the Performance Center’s landing page, Performance center presents the Fintech developer or executive with the list of Starred Dashboards or Recently viewed Dashboards. In case of first time login, These 2 tabs would be empty.
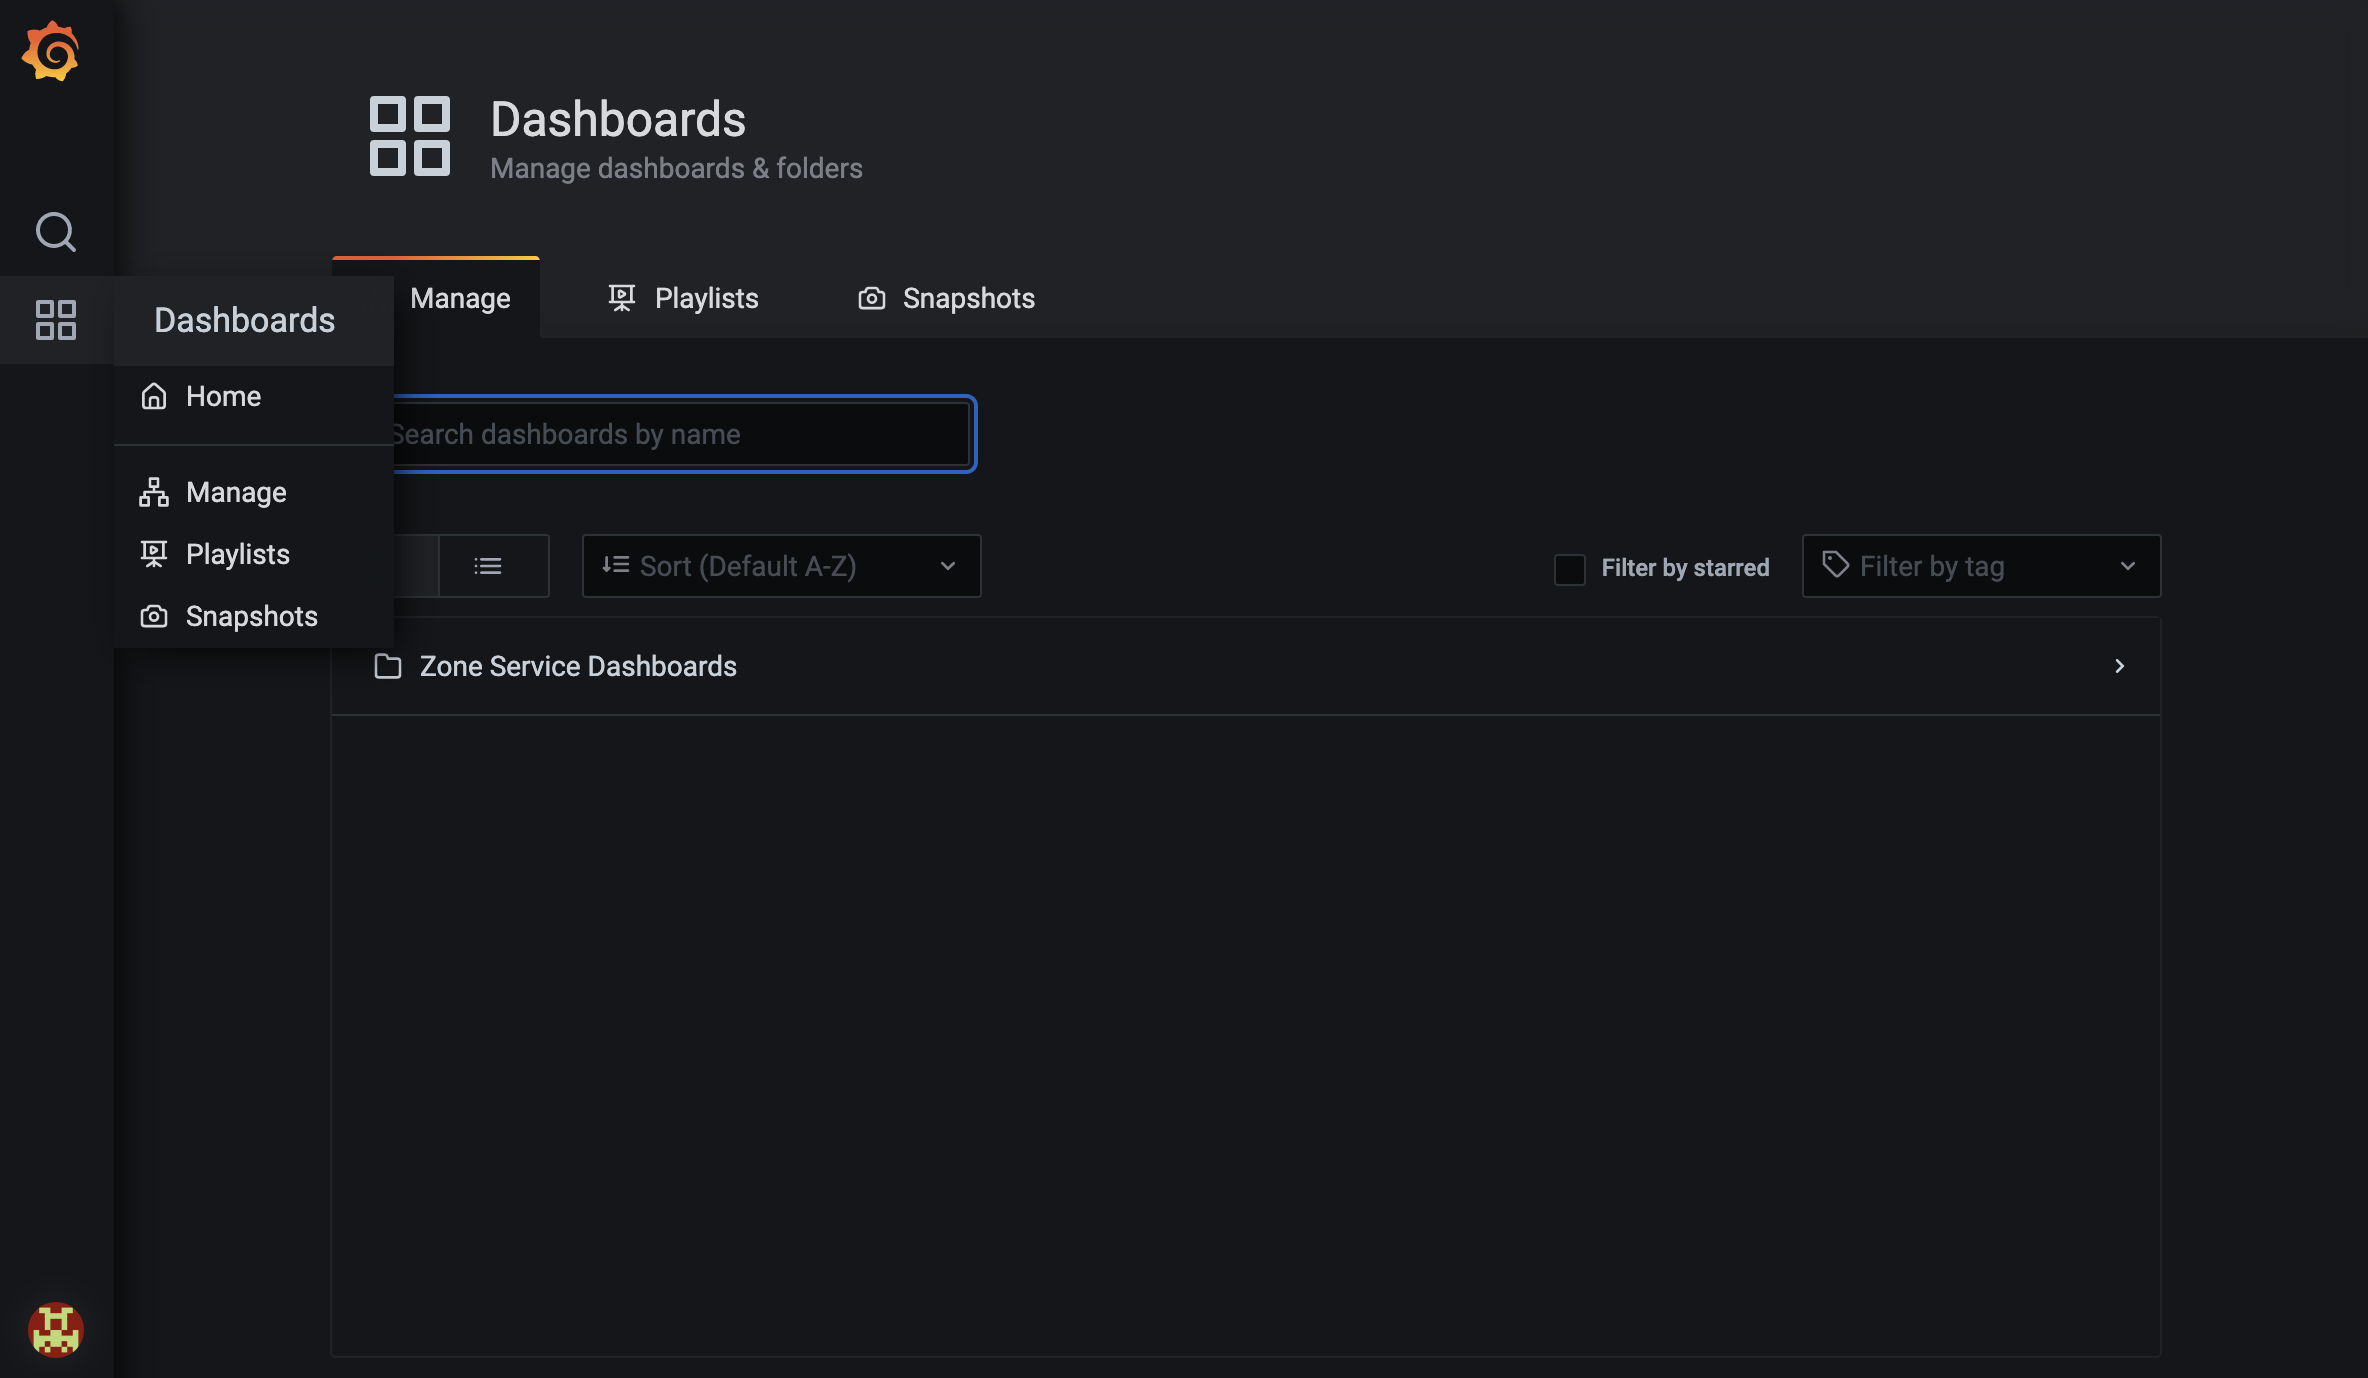
Dashboard Search Feature
In order to search for dashboards, click on the Square icon and go to Manage section.You can see a search bar where you can enter the name of your dashboard and search for it or you can select your dashboard from the list.
Available Dashboards
- Ingress Metrics Dashboard
- Ingress Logs Dashboard
- Egress Logs Dashboard
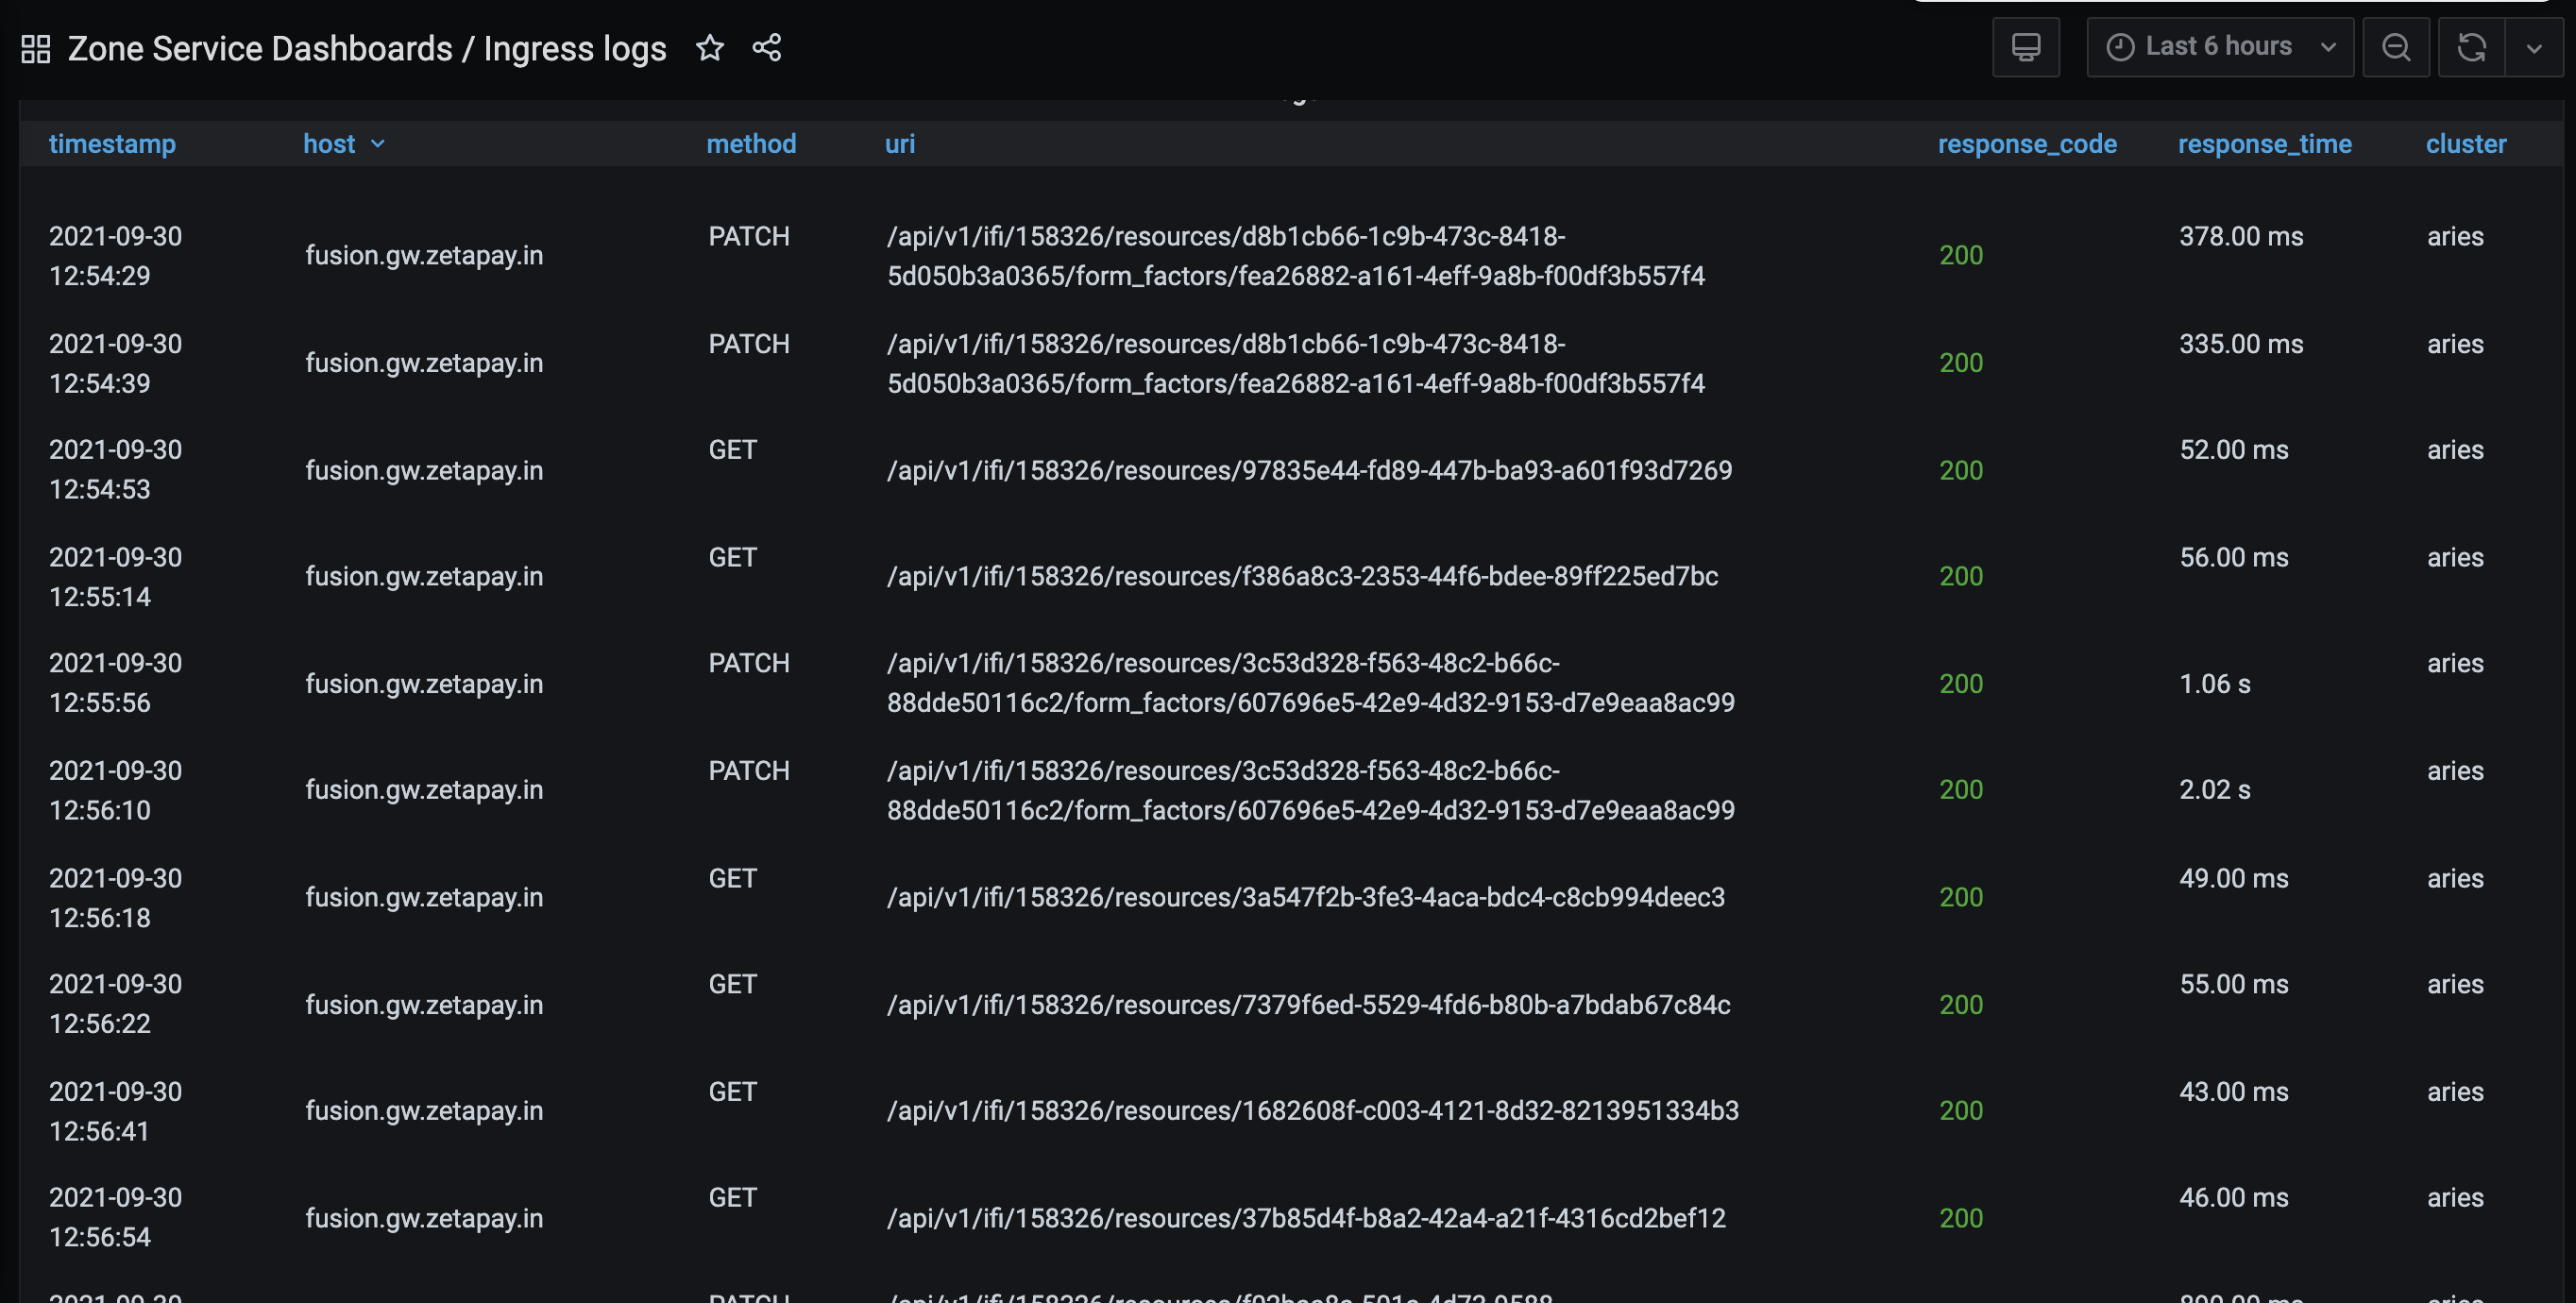
Ingress logs Dashboard
Ingress logs has the details of all the logs for any incoming requests which have been called with respec to that fintech. Eg : If a fintech calls create account holder api call, then a log would be generated with details like the status of the response, how much time it took to respond, what was the host, path, method of the api request etc.
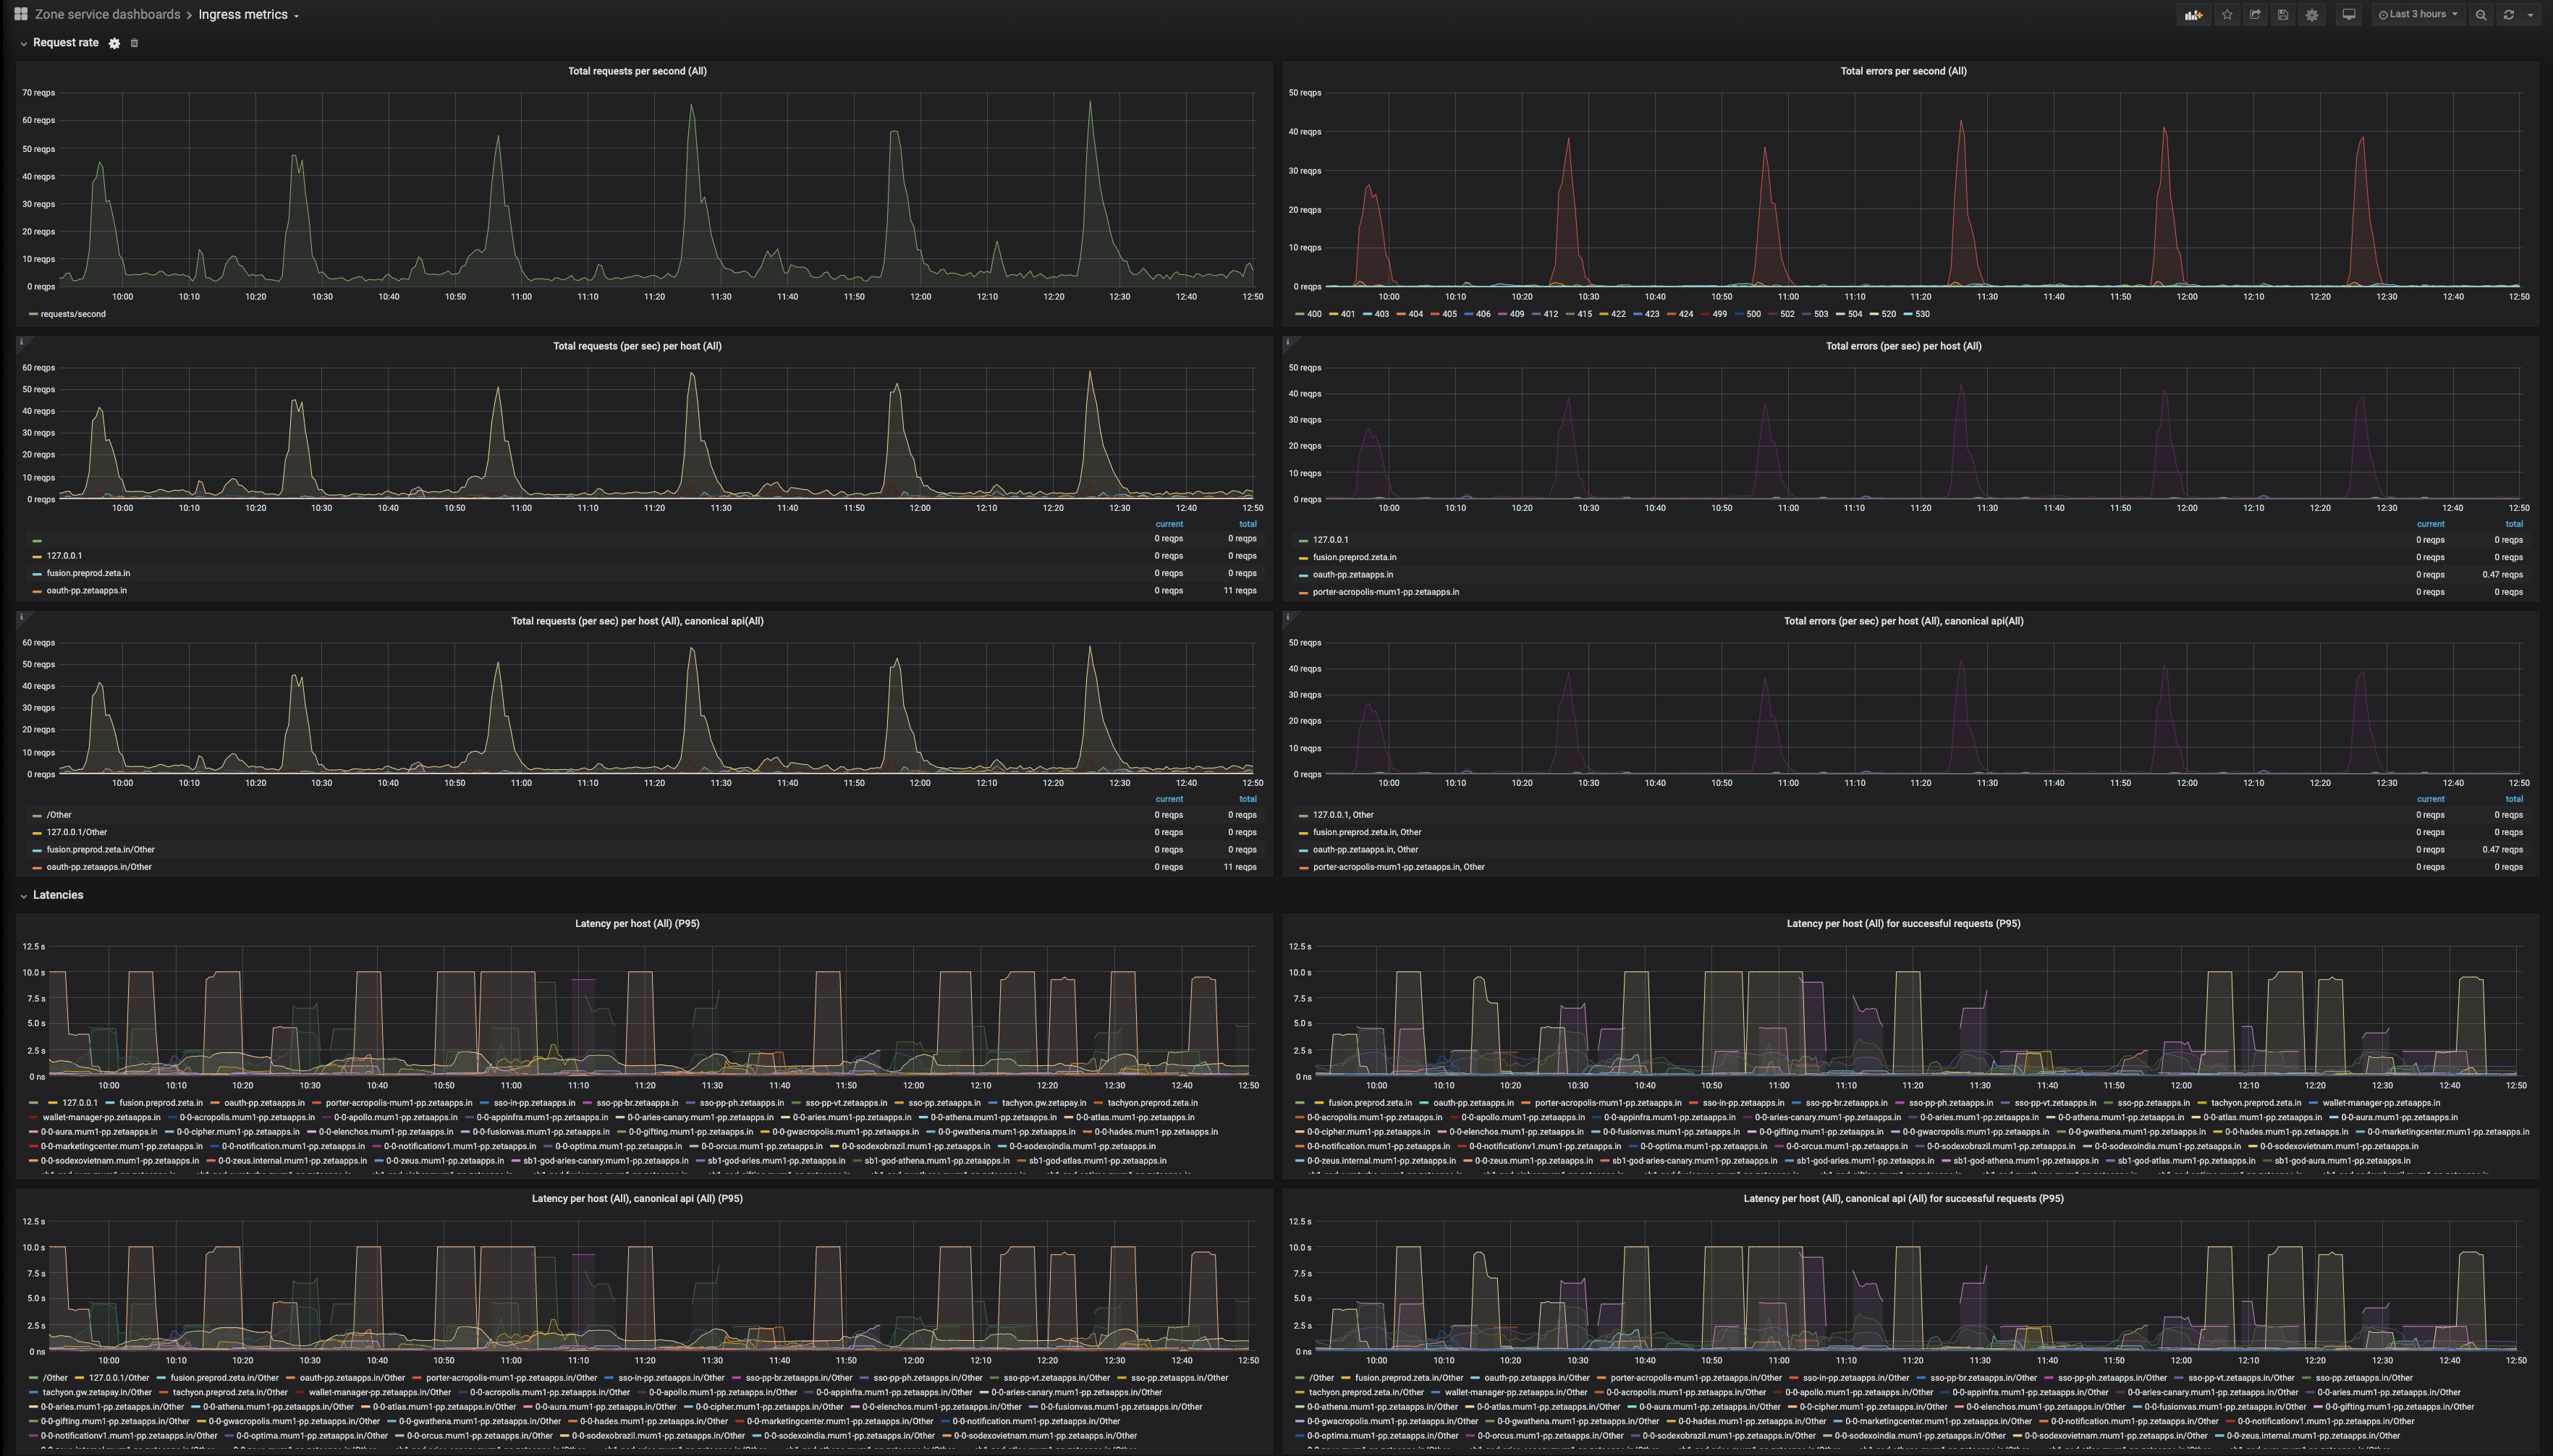
Ingress Metrics Dashboard
Ingress Metrics Dashboard consists the details of the Metrics used to measure the level of service provided to fintechs (e.g., availability, latency, throughput).Post selecting the dashboard,we can see the details for the dashboard like Dashboard name which is Ingress Metrics Dashboard in this case in the top.
Ingress Metrics Details
Different Metrics which are present on the Ingress Metrics dashboard are
Canonical API
Latency
- Latency per host.
- Latency per host, Canonical API
- Latency Per host for all successful requests
- Latency Per host per canonical API
Availability
- Total Requests Per Sec
- Total Requests Per Sec per host
- Total Requests Per Sec per host Canonical API
- Total Errors Per Sec
- Total Errors Per Sec per host
- Total Errors Per Sec per host Canonical API
Throughput
- Successfully processed requests
- Successfully processed requests per host
- Successfully processed requests per sec per host canonical API
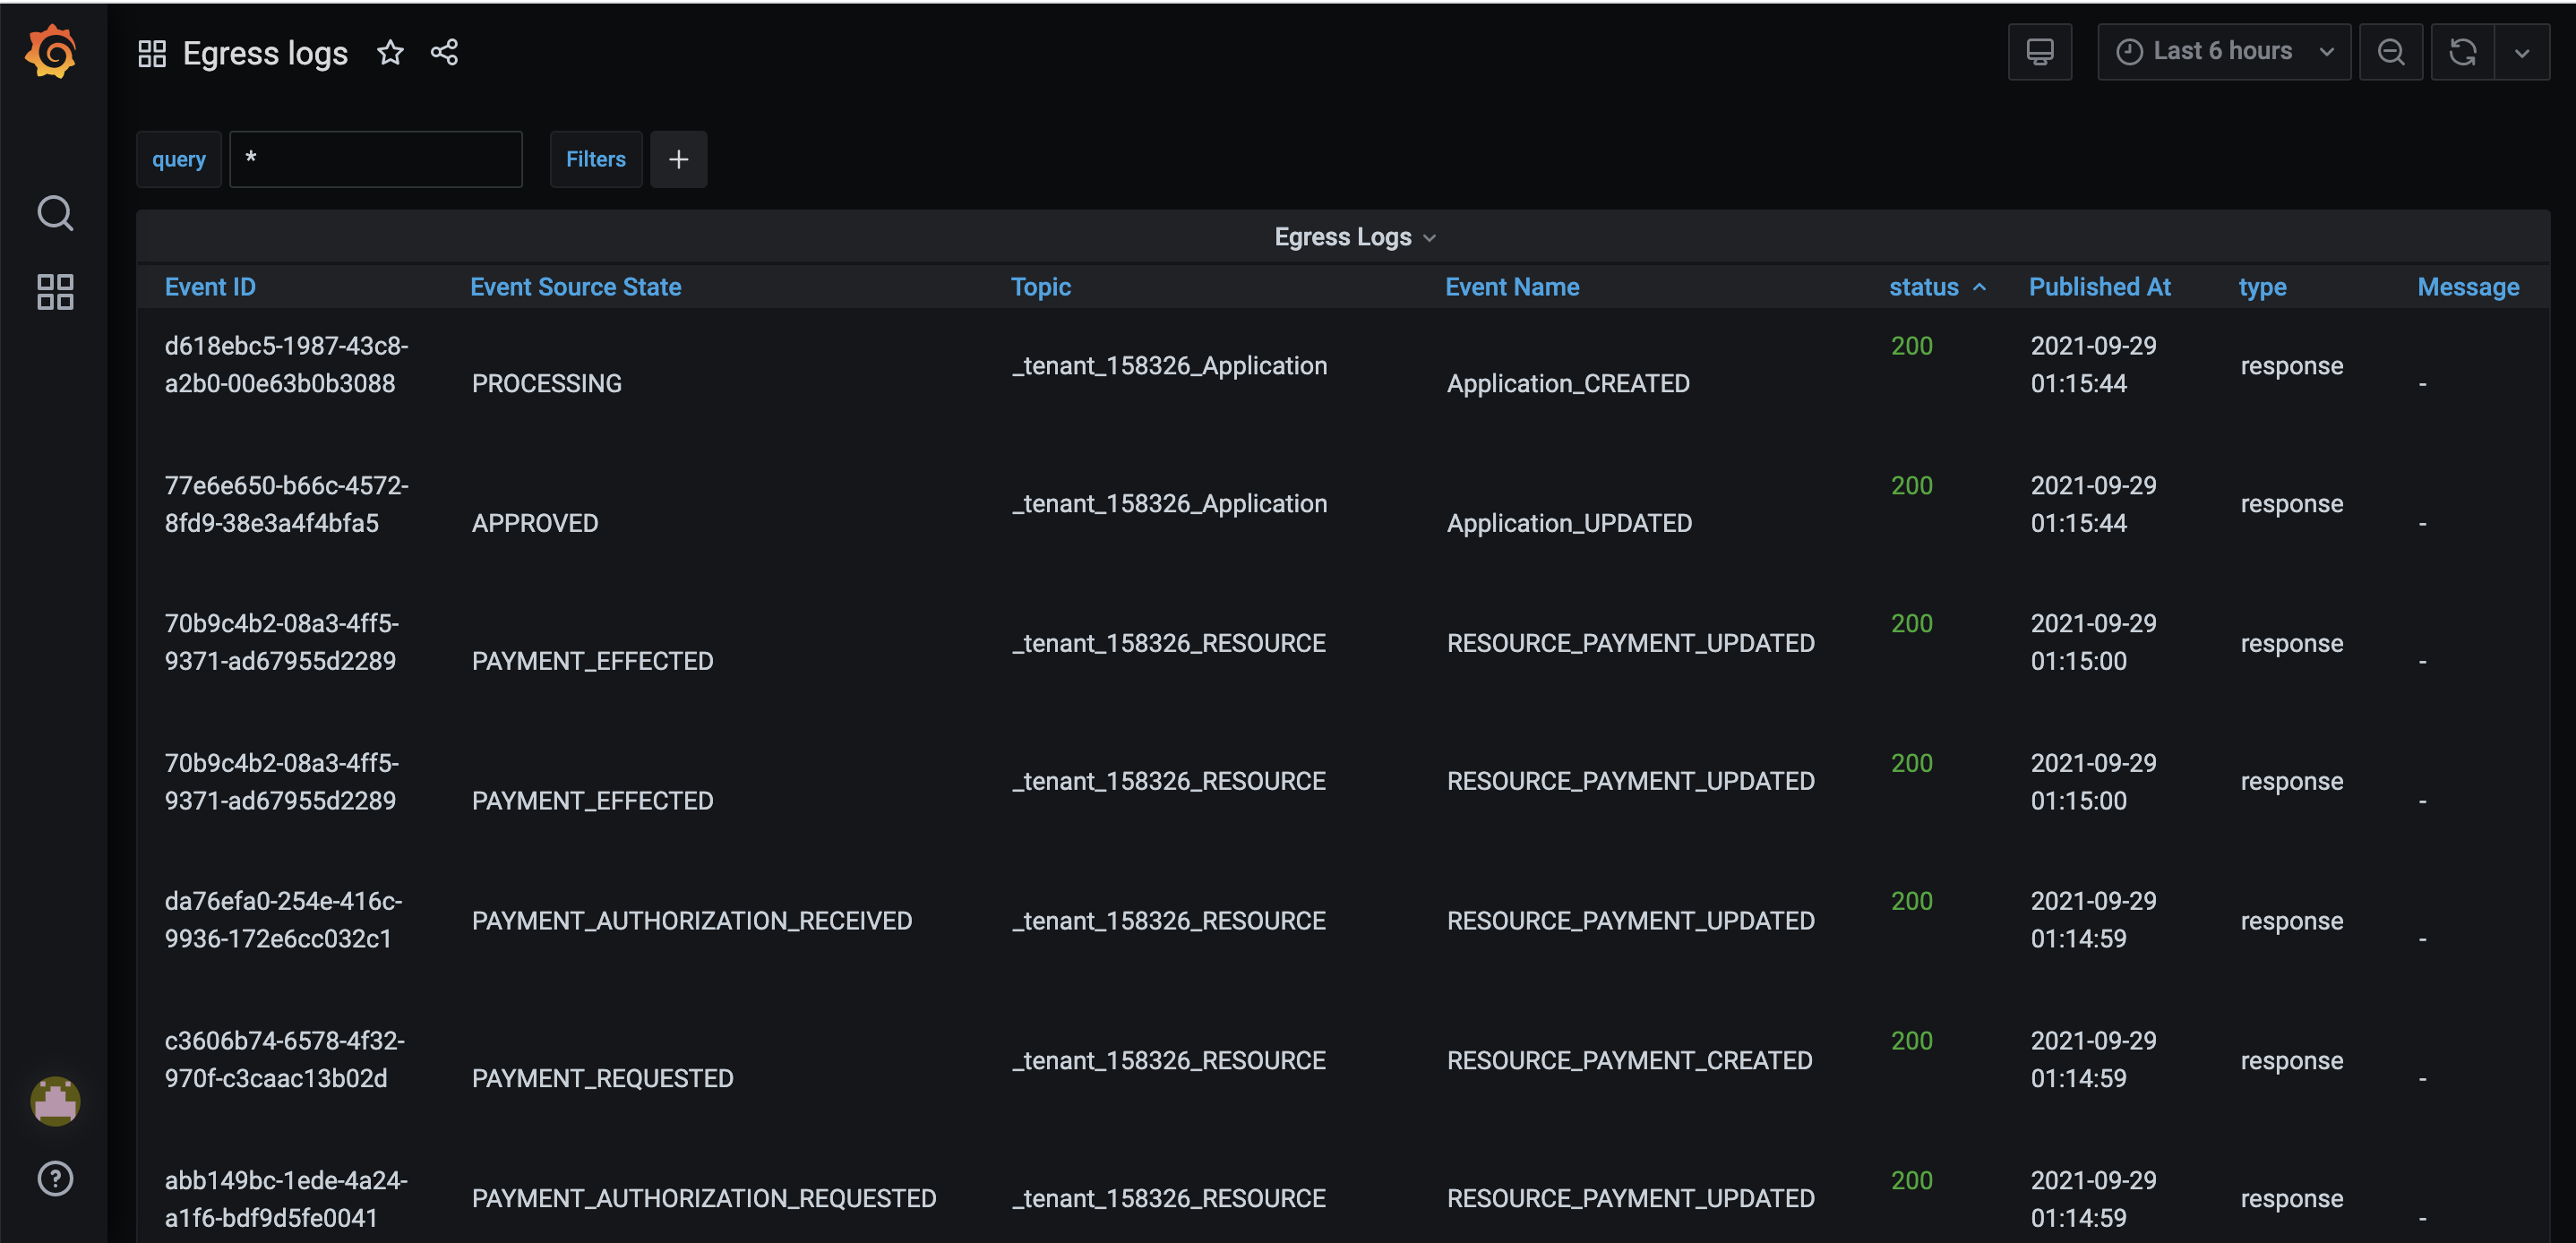
Egress Logs Dashboard
Egress logs has the details of all the logs for the webhook events which have been subscribed by fintechs. Eg : If a fintech has subscribed to Application_Created event then whenever Application_created event is generated, Fintechs see whether communication has been sent to them or not using these Egress logs on Performance Centre.we are also capturing Fintech’s response to event is also captured in the egress logs