What is Performance Center ?
Performance Center is an application performance monitoring tool , which will enable teams to track and monitor status of their SLAs in one place on a near real-time (with a delay of approximately 30 mins) basis. It also provides access to logs that helps teams in troubleshooting and debugging their applications. We plan to provide VBOs access to their API statistics and logs by extending performance center privileges to them.
Getting Started
Logging In
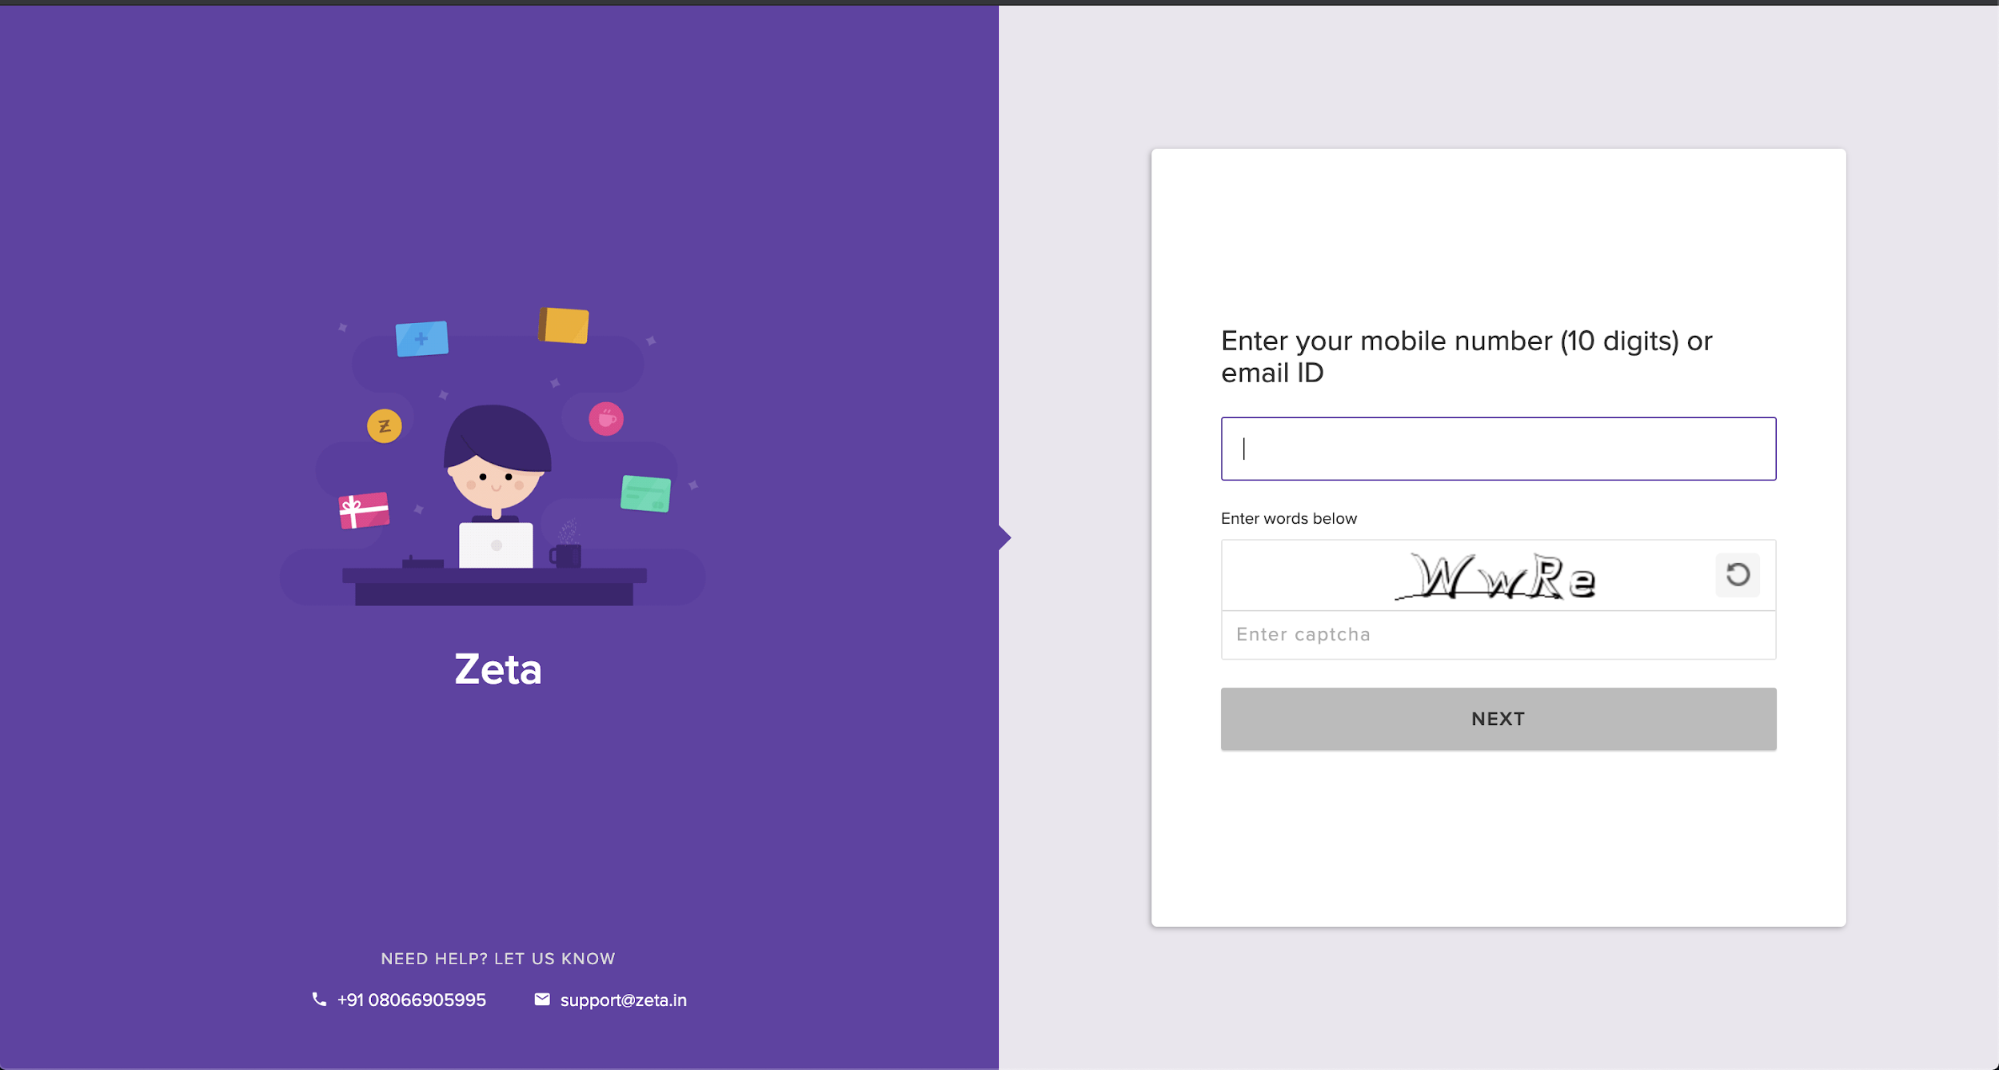
VBO developers/executives with access to an instance of Performance center can login to it via:
- Entering their 10 digit phone number or email ID.
- Verifying the identity via OTP sent to the registered phone or email.
Landing Page & Dashboard Search
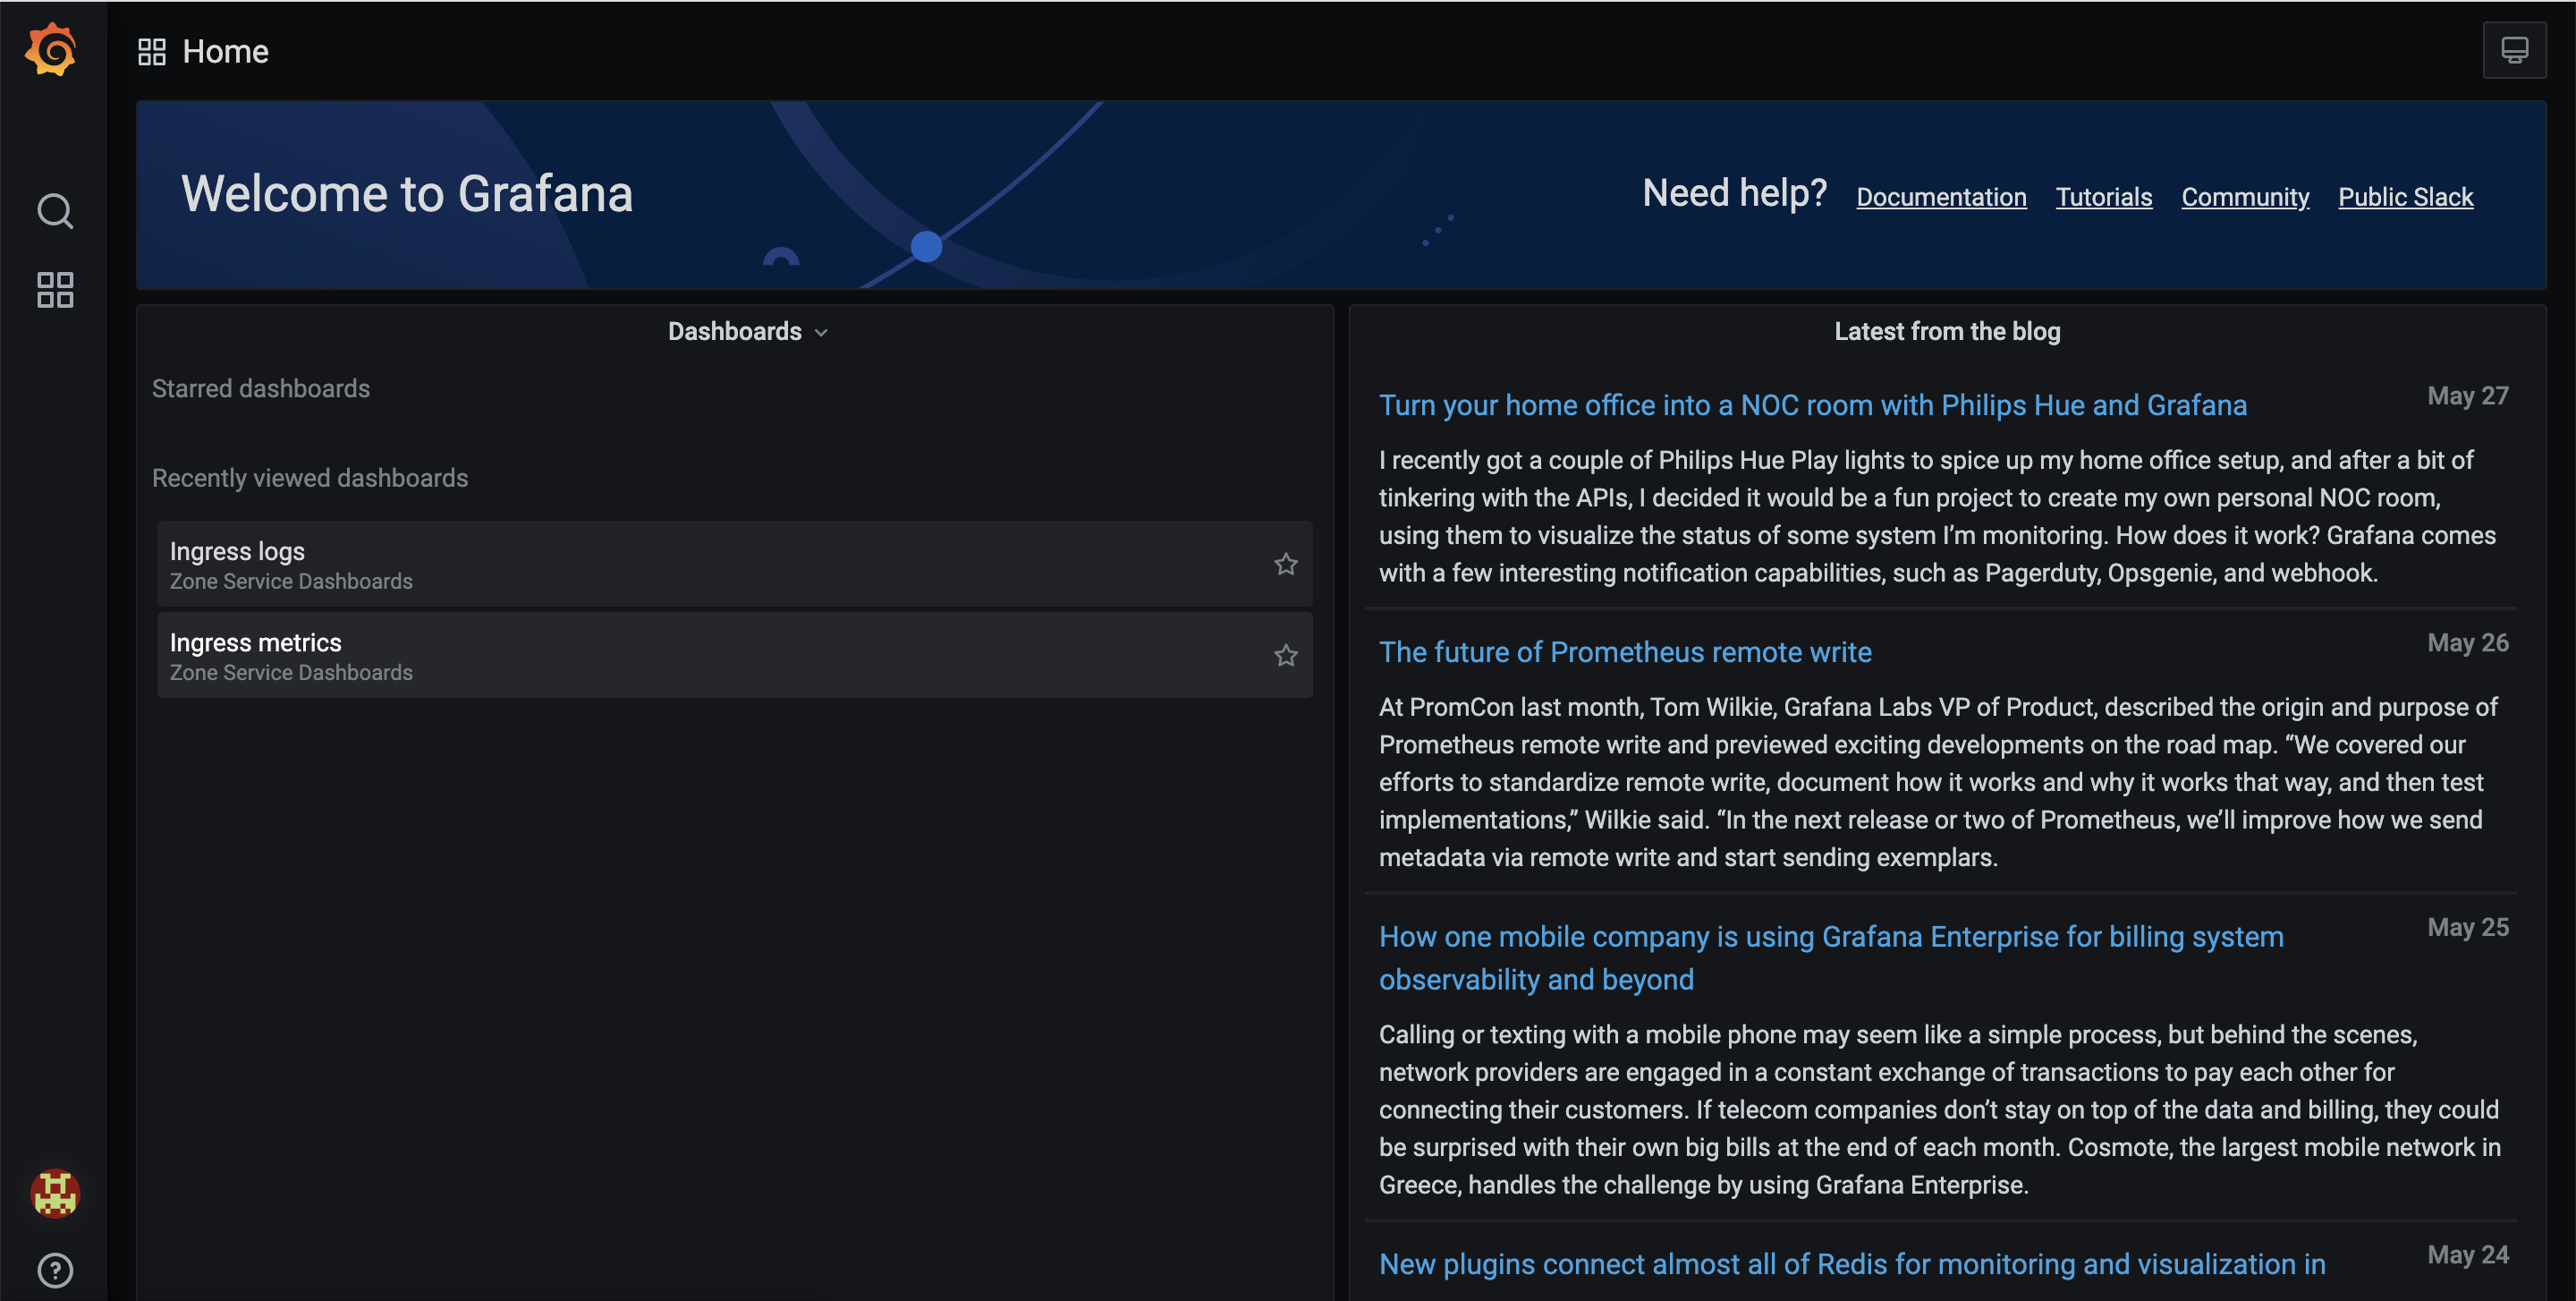
Default Landing Page
On the default landing page, Performance center presents the vbo developer or executive with the list of Starred Dashboards or Recently viewed Dashboards. In case of first time login, These 2 tabs would be empty.
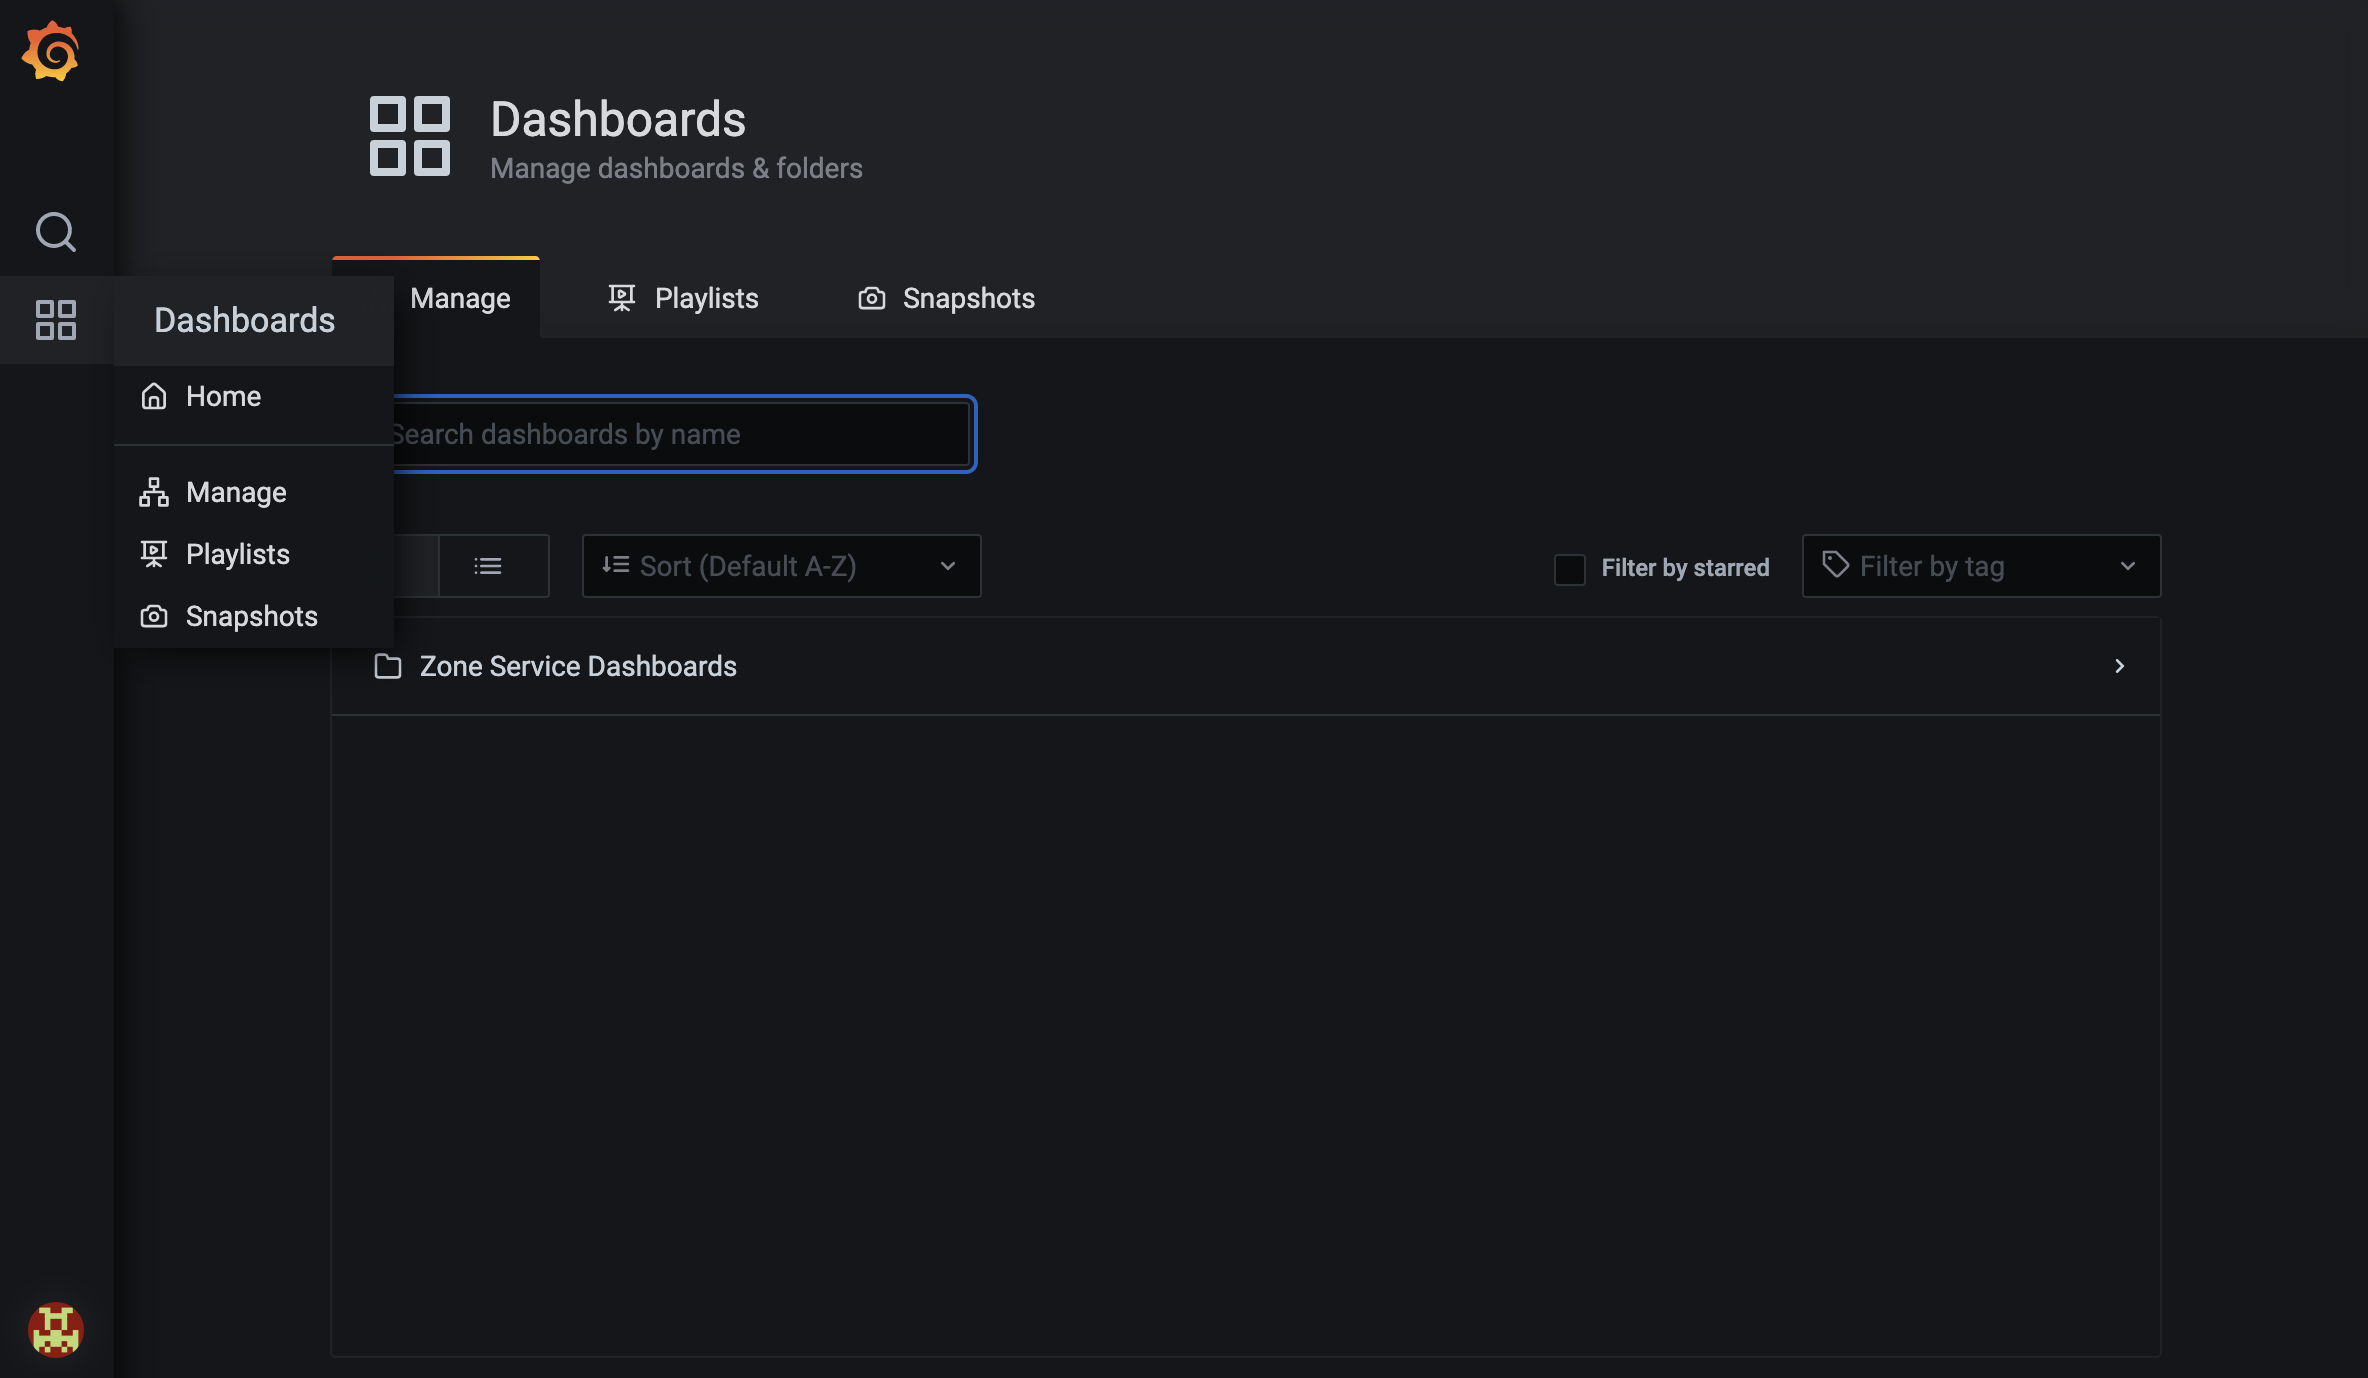
Dashboard Search Feature
In order to search for dashboards, click on the Square icon and go to Manage section.You can see a search bar where you can enter the name of your dashboard and search for it or you can select your dashboard from the list.
Available Dashboards
- Ingress Metrics
- Ingress Logs
- Fusion API Dashboard
Ingress logs Dashboard
Metrics Details
Ingress Metrics Dashboard
Metrics Details
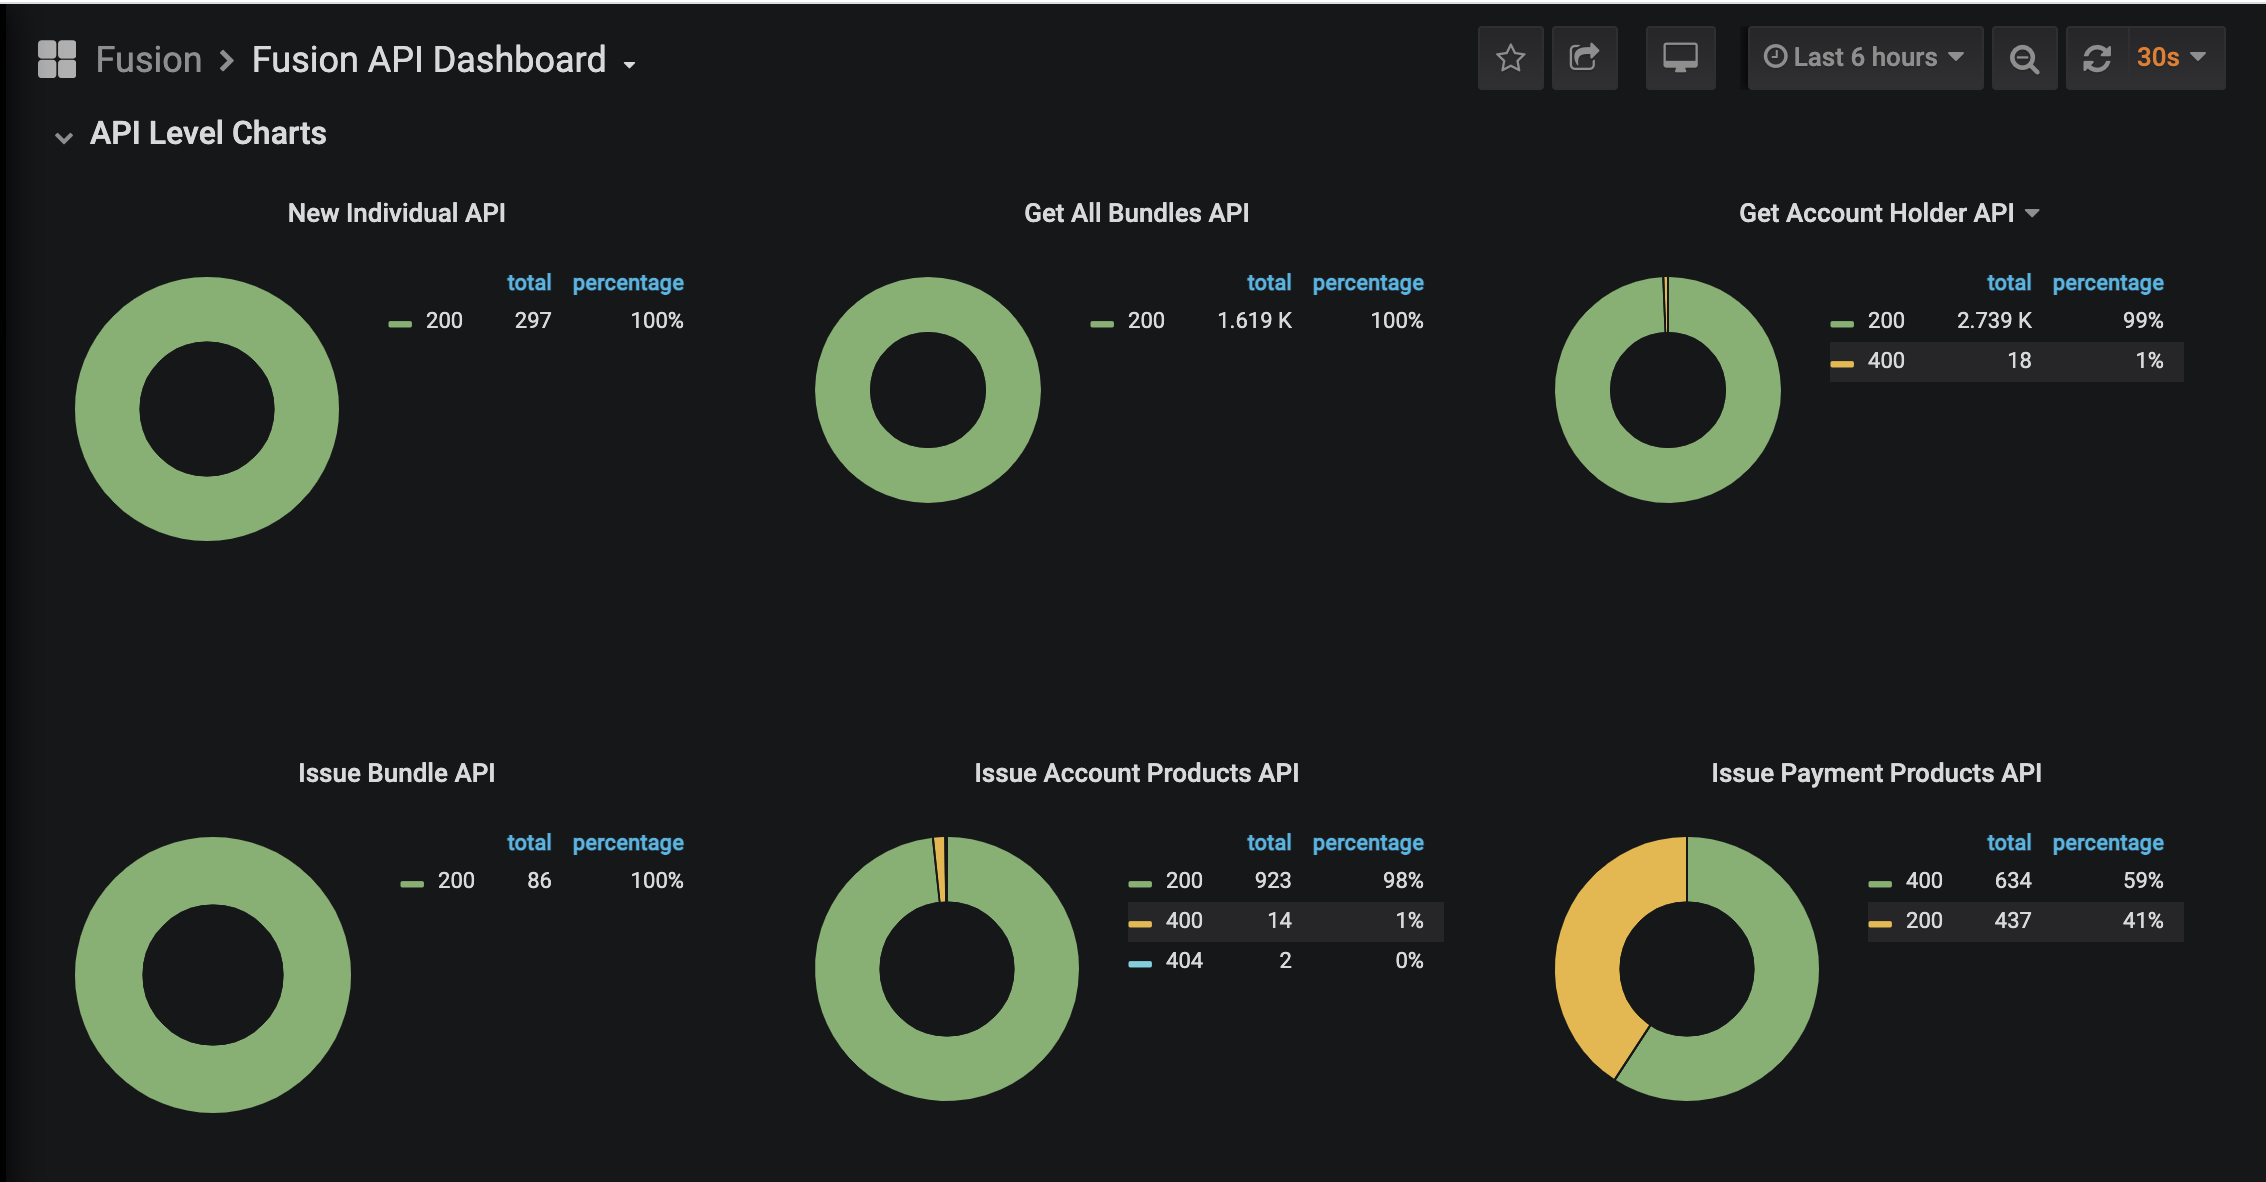
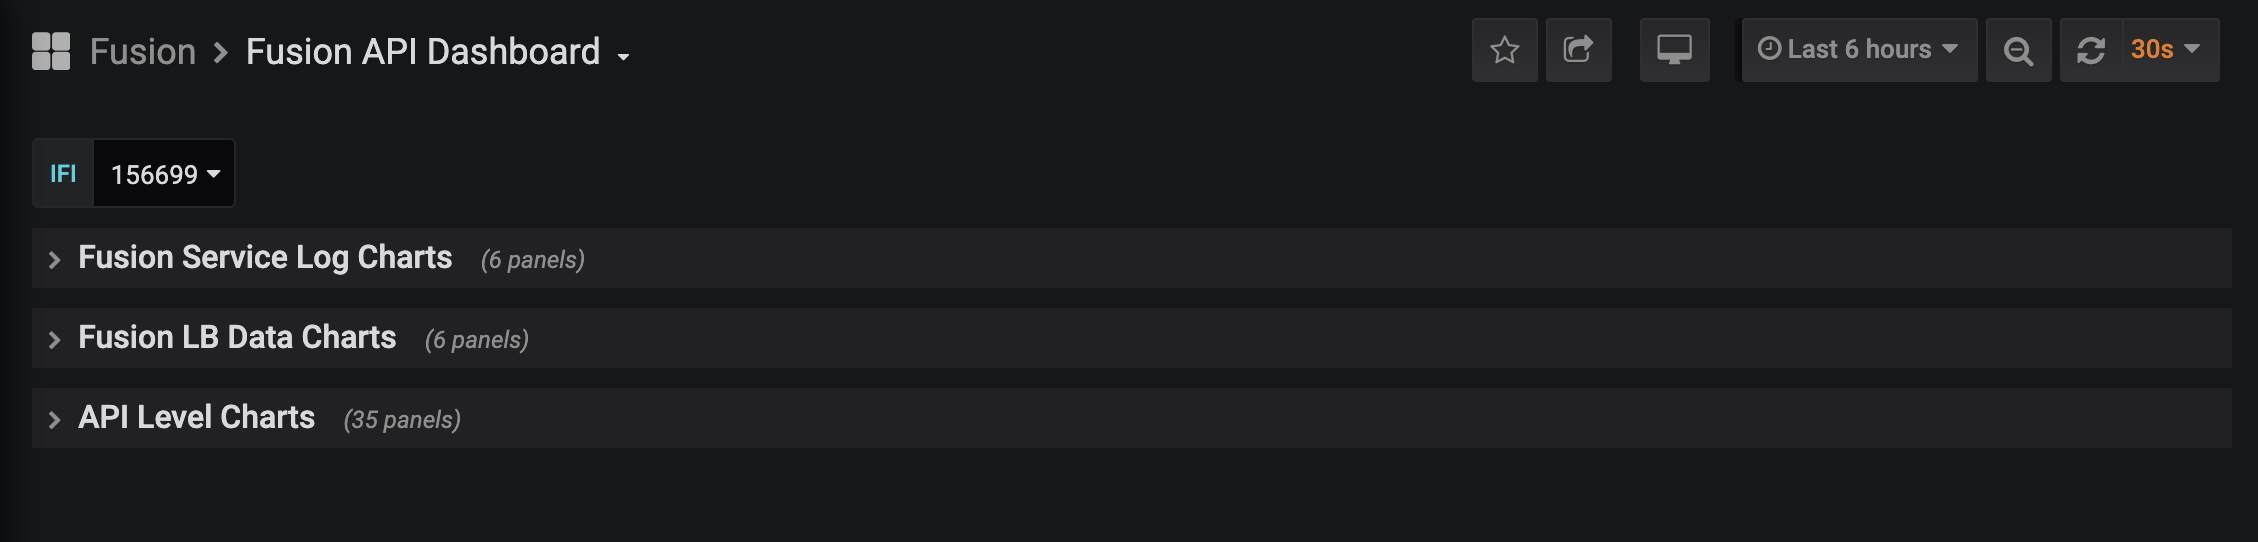
Fusion API Dashboard
Fusion API Dashboard consists the performance details of the fusion API’s which are being consumed by VBO’s. Post selecting the dashboard,we can see the details for the dashboard like Dashboard name which is Fusion API Dashboard in this case in the top, IFI id associated with the dashboard, VBO Id of the VBO for whom the dashboard belongs to.
Metrics Details
Different Metrics which are present on the Fusion API dashboard are
- Total no of Requests Per API
- Total no of Successful Requests per API
- Total no of failed requests per API
- Distribution of amount of response time each API takes.
- Response duration at 99 percentile
- Response duration at 95 percentile
- Overall Distribution of successful vs failure requests
- Distribution of different API responses for each individual API
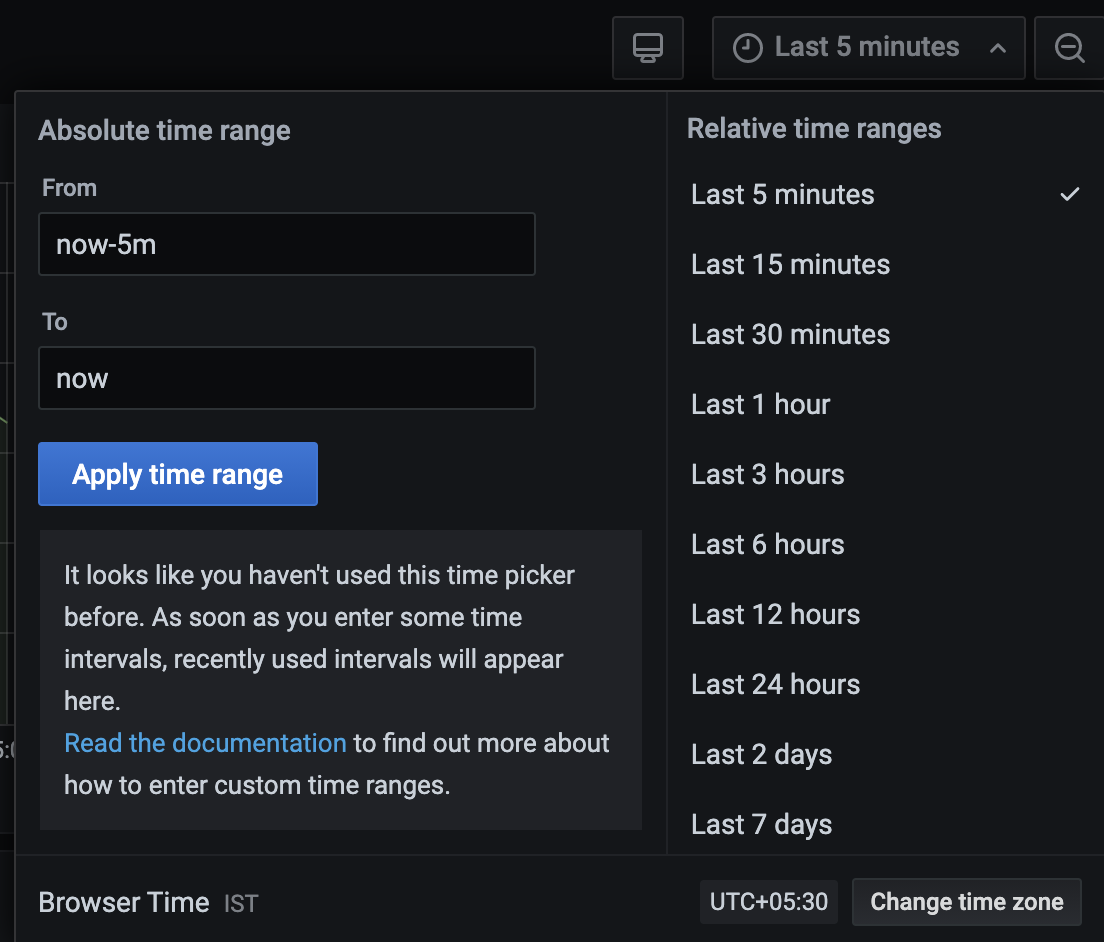
Filter options
Further, we can filter out the charts available for specific time period as well. We have 2 filter options available, Relative time range eg : Last 10 mins ,Last 24 hrs and Absolute time range where you define the From and To of the time Range. There is an option to change the Timezone for the dashboard as well.
Fusion Service Log Charts
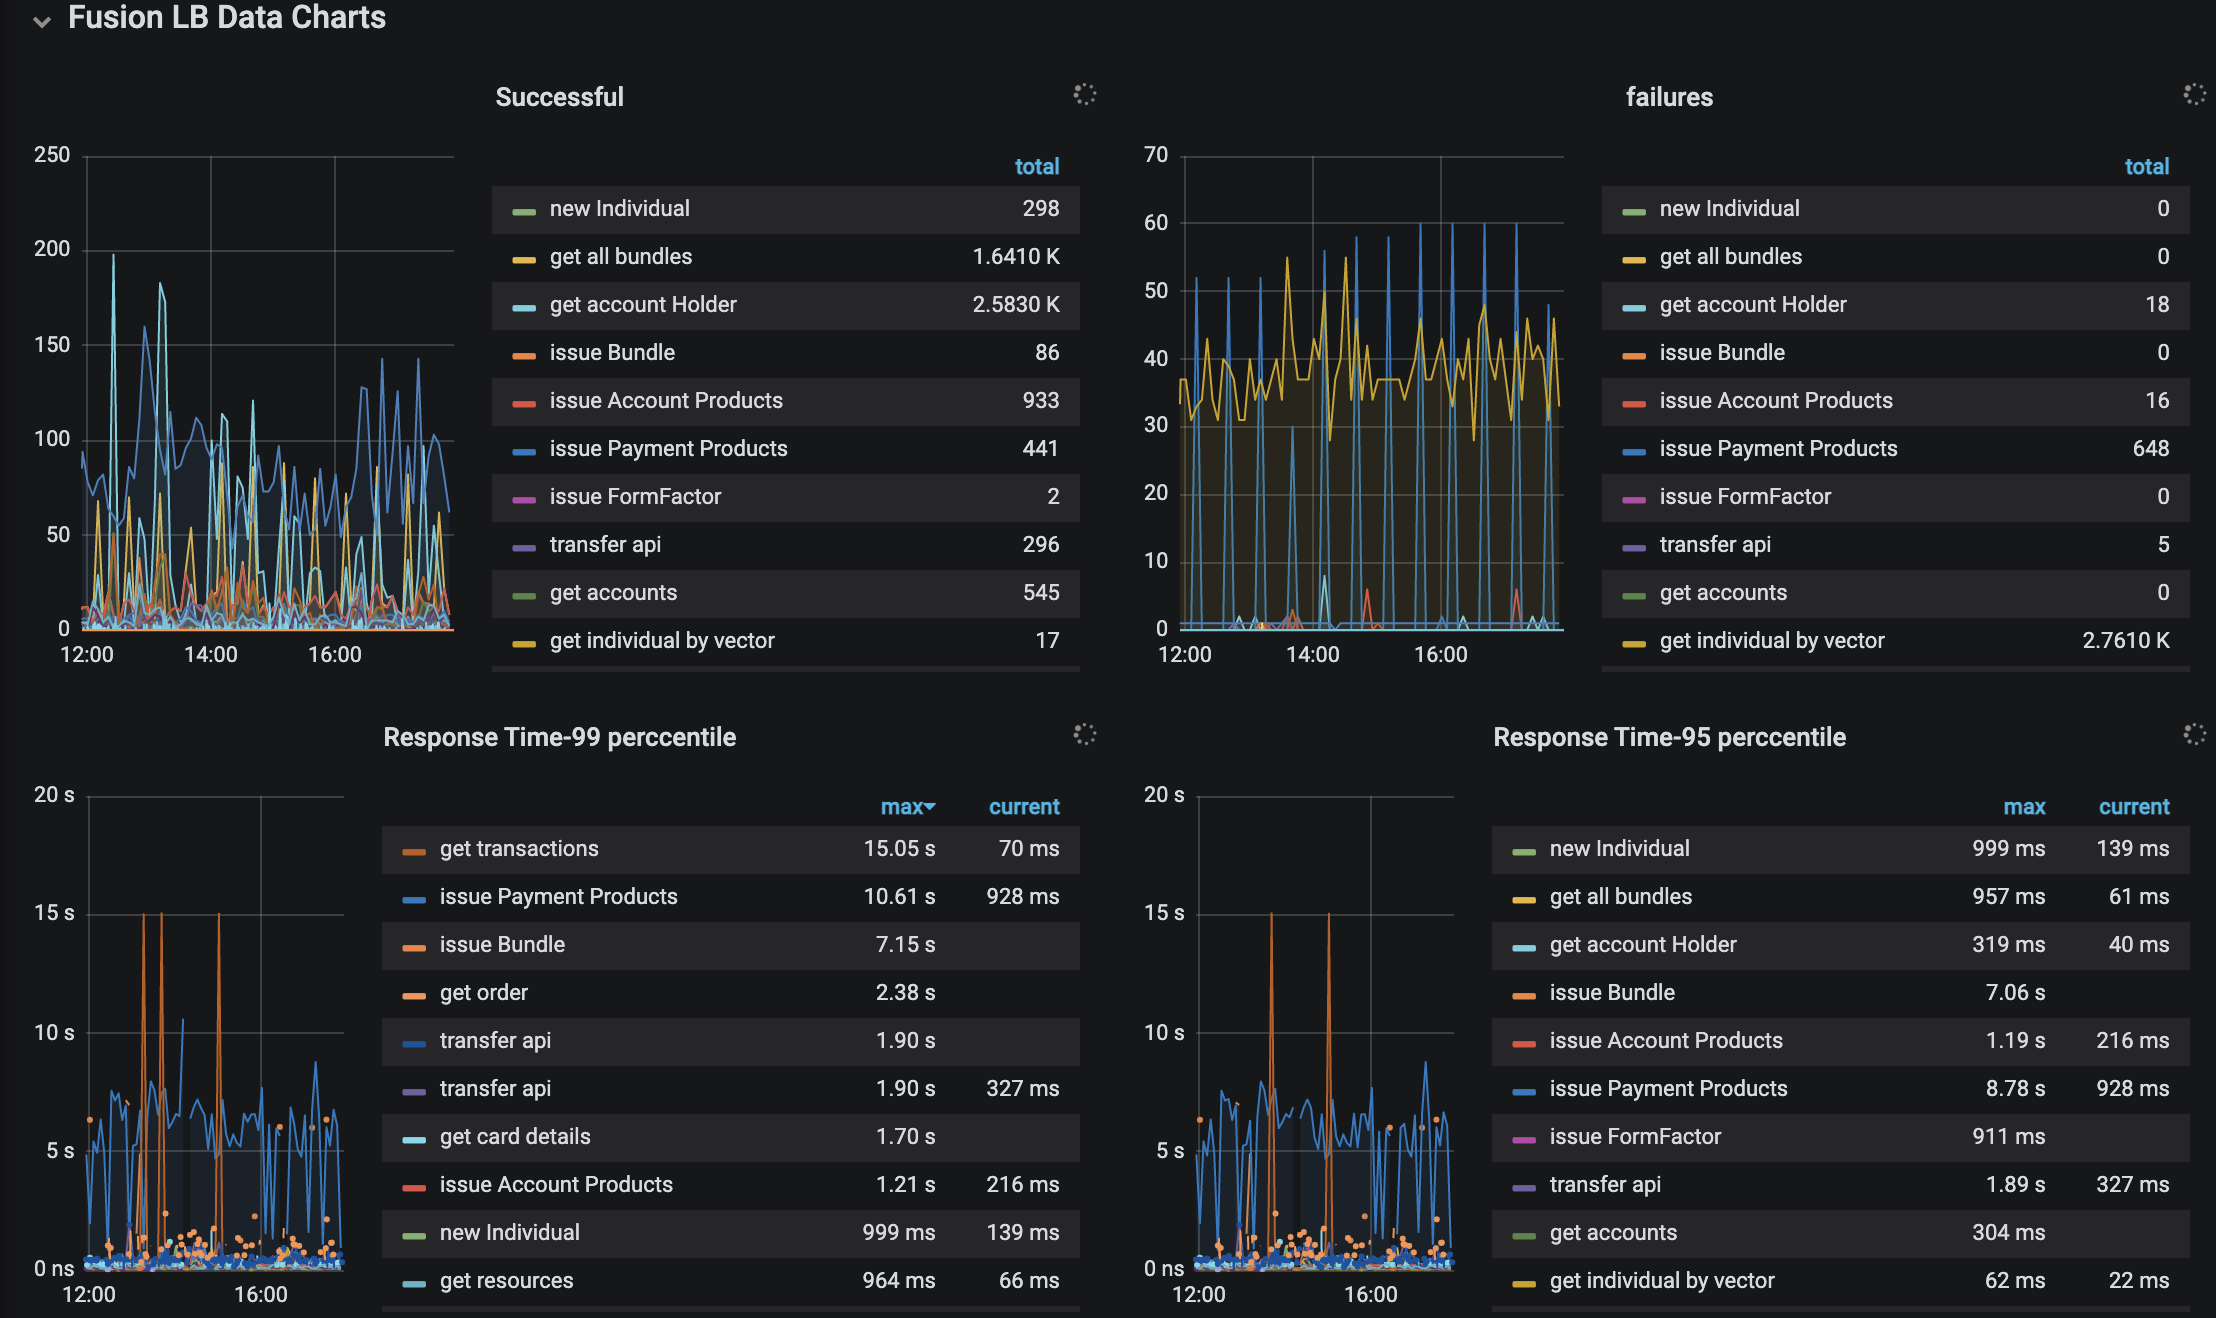
Fusion LB Data Charts
Fusion LB(Load Balancer) Data charts contains the RED Metrics for all Fusion API’s. As of now, we have this data available for 35 Fusion API’s.Below are some of the data points available with respect to (w.r.t) each API.
- (Request) Rate - Number of requests, per second fusion API’s are serving.
- (Request) Duration - Distributions of the amount of time each request takes. We have overall duration, response duration at 95 percentile and response duration at 99 percentile.
- (Request) Errors - Number of failed requests per second.
- Overall Failure Percentage : Distribution between successful requests and unsuccessful requests for all the API’s
Fusion API Level Charts
API Level charts contains data at an API level.As of now, we have this data available for 35 Fusion API’s. Below are some of the data points available with respect to (w.r.t) each API.
- Total Number of Requests
- Number of Requests w.r.t API Status
- Percentage (%)of Requests w.r.t API status